EXHIBIT 99.2
Published on December 5, 2016

Patrick Industries, Inc.
Investor Presentation
December 2016
NASDAQ: PATK
Forward-Looking Statements
This presentation contains certain statements related to future results or states
our intentions, beliefs and expectations or predictions for the future which are
forward-looking statements as that term is defined in the Private Securities
Litigation Reform Act of 1995. These forward-looking statements are subject to
certain risks and uncertainties that could cause actual results to differ materially
from either historical or anticipated results depending on a variety of factors.
Further information concerning the Company and its business, including factors
that potentially could materially affect the Company’s financial results, is
contained in the Company’s filings with the Securities and Exchange
Commission.
This presentation includes market and industry data, forecasts and valuations
that have been obtained from independent consultant reports, publicly available
information, various industry publications and other published industry sources.
Although we believe these sources are reliable, we have not independently
verified the information and cannot make any representation as to the accuracy
or completeness of such information.
We disclaim any obligation or undertaking to disseminate any updates or
revisions to any forward-looking statements contained in this presentation or to
reflect any change in our expectations after the date of this presentation or any
change in events, conditions or circumstances on which any statement is based.
2

Company Overview
4
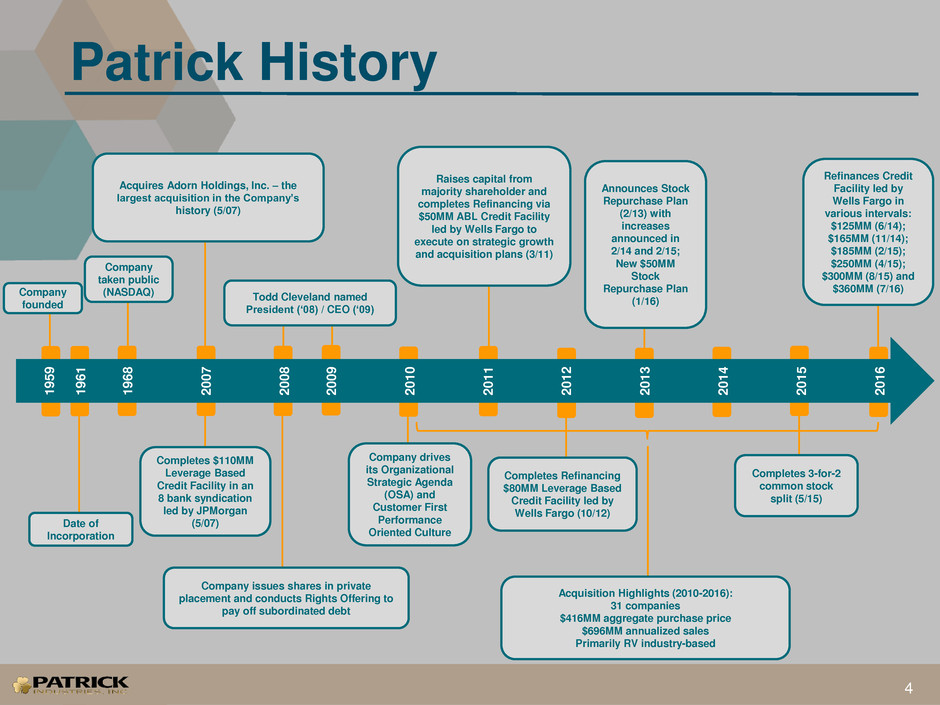
Patrick History
1
9
5
9
1
9
6
1
1
9
6
8
2
0
0
7
2
0
0
8
2
0
0
9
2
0
1
0
2
0
1
1
2
0
1
2
2
0
1
3
2
0
1
4
2
0
1
5
2
0
1
6
Company issues shares in private
placement and conducts Rights Offering to
pay off subordinated debt
Company drives
its Organizational
Strategic Agenda
(OSA) and
Customer First
Performance
Oriented Culture
Completes Refinancing
$80MM Leverage Based
Credit Facility led by
Wells Fargo (10/12)
Company
founded
Company
taken public
(NASDAQ)
Date of
Incorporation
Acquires Adorn Holdings, Inc. – the
largest acquisition in the Company’s
history (5/07)
Refinances Credit
Facility led by
Wells Fargo in
various intervals:
$125MM (6/14);
$165MM (11/14);
$185MM (2/15);
$250MM (4/15);
$300MM (8/15) and
$360MM (7/16)
Acquisition Highlights (2010-2016):
31 companies
$416MM aggregate purchase price
$696MM annualized sales
Primarily RV industry-based
Announces Stock
Repurchase Plan
(2/13) with
increases
announced in
2/14 and 2/15;
New $50MM
Stock
Repurchase Plan
(1/16)
Completes 3-for-2
common stock
split (5/15)
Completes $110MM
Leverage Based
Credit Facility in an
8 bank syndication
led by JPMorgan
(5/07)
Raises capital from
majority shareholder and
completes Refinancing via
$50MM ABL Credit Facility
led by Wells Fargo to
execute on strategic growth
and acquisition plans (3/11)
Todd Cleveland named
President (‘08) / CEO (‘09)
Patrick at a Glance
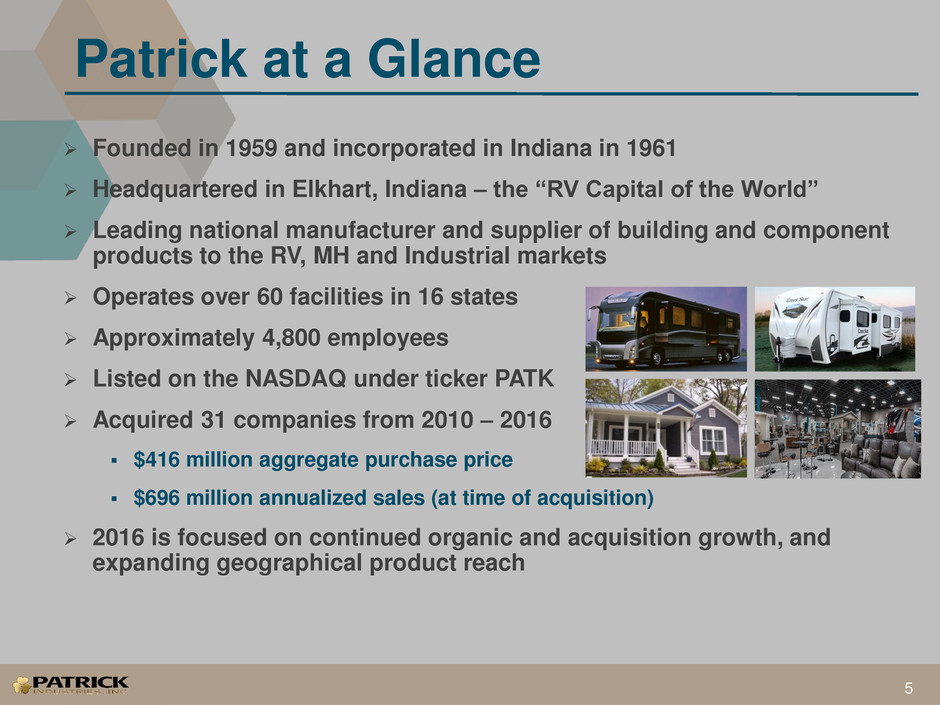
Founded in 1959 and incorporated in Indiana in 1961
Headquartered in Elkhart, Indiana – the “RV Capital of the World”
Leading national manufacturer and supplier of building and component
products to the RV, MH and Industrial markets
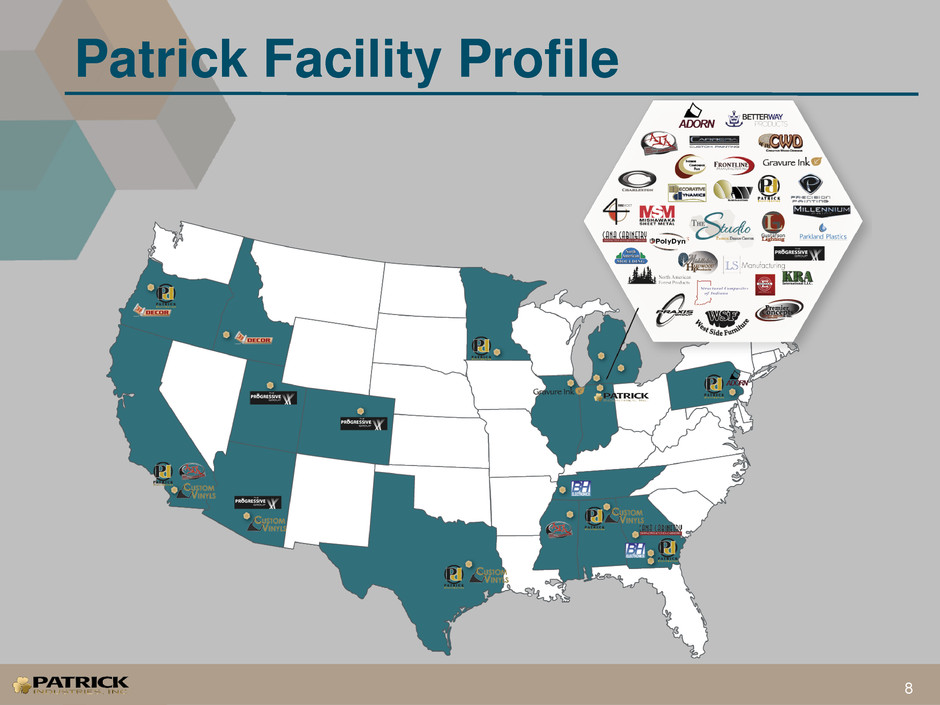
Operates over 60 facilities in 16 states
Approximately 4,800 employees
Listed on the NASDAQ under ticker PATK
Acquired 31 companies from 2010 – 2016
$416 million aggregate purchase price
$696 million annualized sales (at time of acquisition)
2016 is focused on continued organic and acquisition growth, and
expanding geographical product reach
5
Strong Brands
6
P
ro
d
u
ct Port
fo
li
o
Industries Overview
7
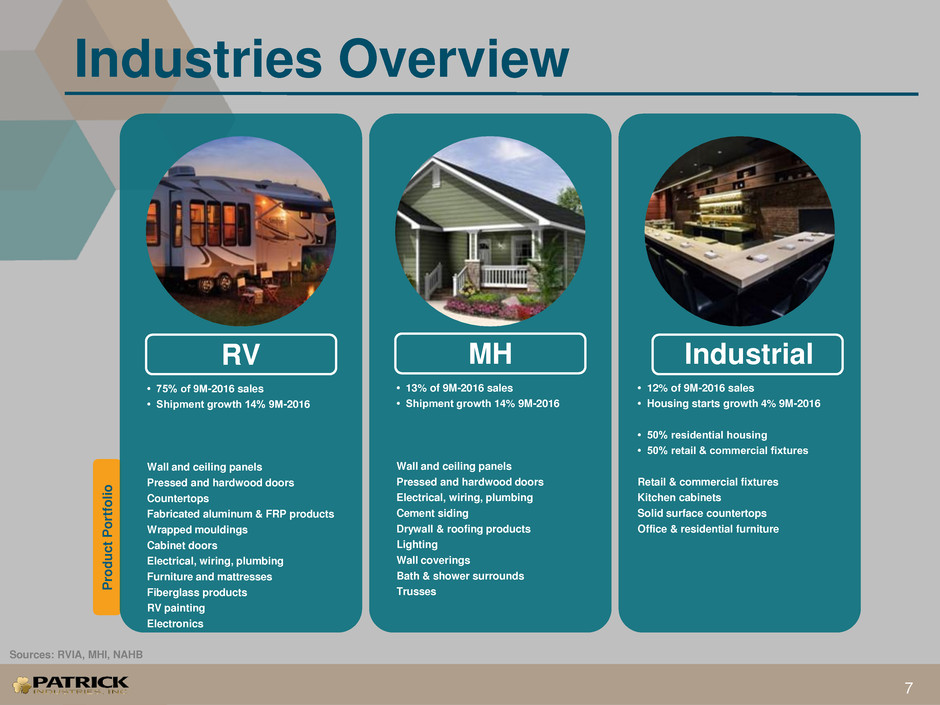
RV
• 75% of 9M-2016 sales
• Shipment growth 14% 9M-2016
Wall and ceiling panels
Pressed and hardwood doors
Countertops
Fabricated aluminum & FRP products
Wrapped mouldings
Cabinet doors
Electrical, wiring, plumbing
Furniture and mattresses
Fiberglass products
RV painting
Electronics
MH
• 13% of 9M-2016 sales
• Shipment growth 14% 9M-2016
Wall and ceiling panels
Pressed and hardwood doors
Electrical, wiring, plumbing
Cement siding
Drywall & roofing products
Lighting
Wall coverings
Bath & shower surrounds
Trusses
Industrial
• 12% of 9M-2016 sales
• Housing starts growth 4% 9M-2016
• 50% residential housing
• 50% retail & commercial fixtures
Retail & commercial fixtures
Kitchen cabinets
Solid surface countertops
Office & residential furniture
Sources: RVIA, MHI, NAHB
Patrick Facility Profile
8
+13%
$24
+28%
$31
+38%
$42
$30
35%
$41
+11%
$1.49
+29%
$1.91
+42%
$2.72
$1.95
+37%
$2.68
2013 2014 2015 9M-15 9M-16
Earnings Growth
Net Income Diluted EPS
+36%
$595
+24%
$736
+25%
$920
$672
+34%
$898
2013 2014 2015 9M-15 9M-16
Sales Growth
Sales
Sales & Earnings Growth
9
($ in millions except per share amounts)
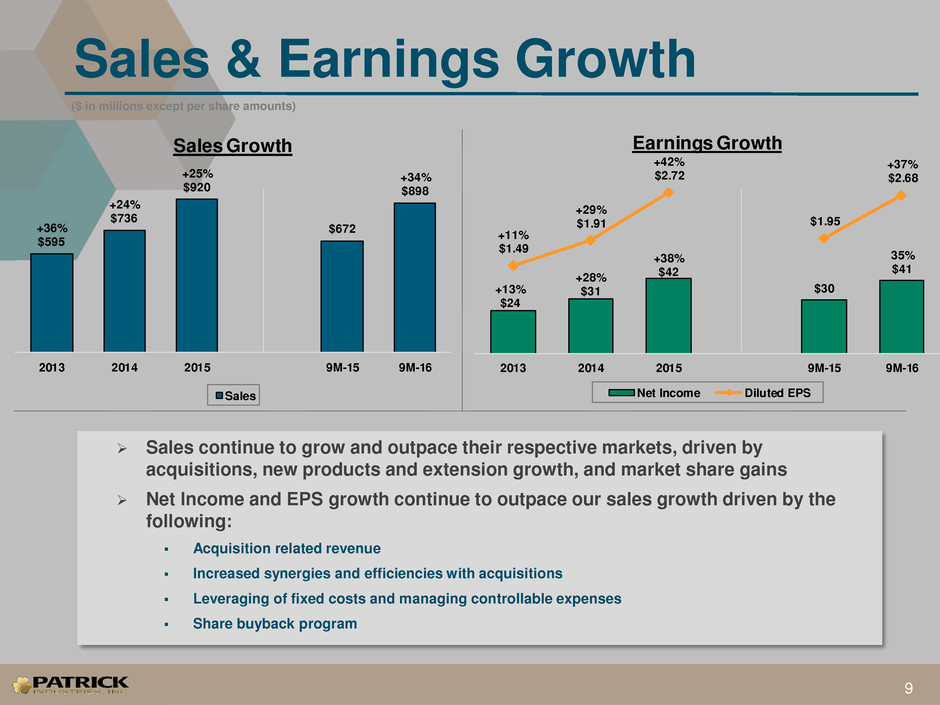
Sales continue to grow and outpace their respective markets, driven by
acquisitions, new products and extension growth, and market share gains
Net Income and EPS growth continue to outpace our sales growth driven by the
following:
Acquisition related revenue
Increased synergies and efficiencies with acquisitions
Leveraging of fixed costs and managing controllable expenses
Share buyback program
$44
$66
$91
$119
$152
$13
$27
$41
$51
$70
10.9%
11.8%
13.5%
14.4%
15.5% 15.7% 15.2% 15.0% 15.0% 15.2% 15.1%
15.3% 15.4%
15.7% 16.0%
16.1% 16.1% 16.2% 16.3%
16.5% 16.6% 16.8% 16.7%
1.6%
2.2%
3.7%
4.4%
5.9%
6.2% 6.2%
6.2% 6.3%
6.8% 6.7% 6.8%
6.9% 6.9%
7.0%
7.0% 7.0%
7.2% 7.3%
7.6% 7.7% 7.8%
7.9%
$0
$20
$40
$60
$80
$100
$120
$140
$160
$180
0%
2%
4%
6%
8%
10%
12%
14%
16%
18%
($ millions)M
arg
in
%
Gross Margin Operating Income
Gross Margin % Operating Margin %
Margin Expansion
10
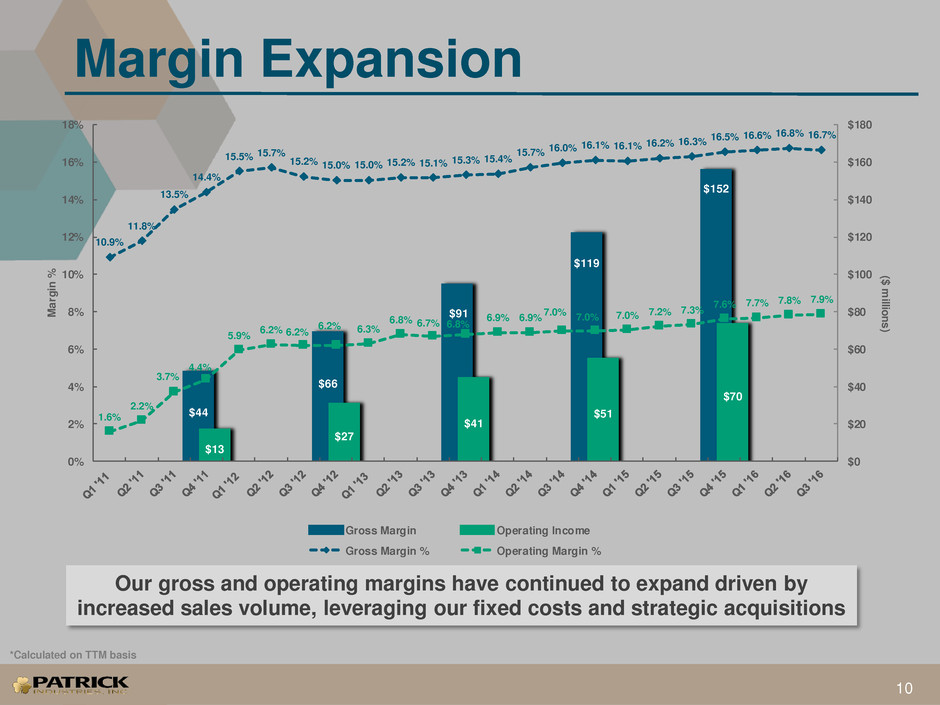
Our gross and operating margins have continued to expand driven by
increased sales volume, leveraging our fixed costs and strategic acquisitions
*Calculated on TTM basis

RV Market
227
258
283
313
327
249
283
25
28
38
44
47
36
41
252
+13%
286
+12%
321
+11%
357
+5%
374
285
+14%
324
$187
+60%
$300
+43%
$430
+27%
$548
+26%
$691
$506
+33%
$674
2011 2012 2013 2014 2015 9M-15 9M-16
Towable Shipments Motorized Shipments Patrick RV Sales
RV Market
Sales Growth
12
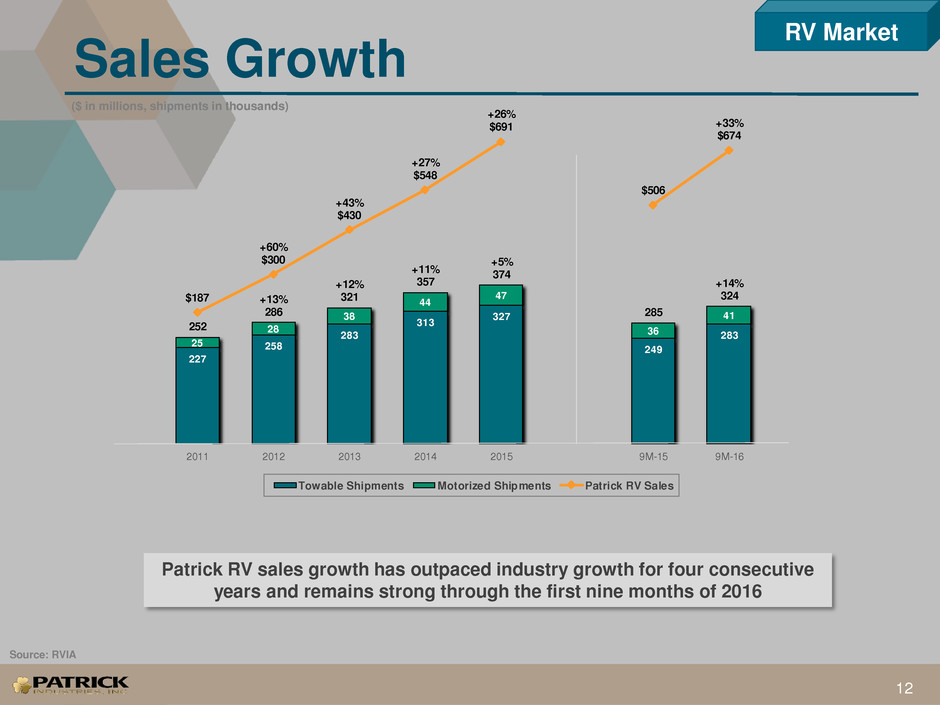
Patrick RV sales growth has outpaced industry growth for four consecutive
years and remains strong through the first nine months of 2016
($ in millions, shipments in thousands)
Source: RVIA
RV Market
Drivers of Market Growth
13
Long-
Term
Market
Growth
Industry Strength
Economy
Demographics
Lifestyle
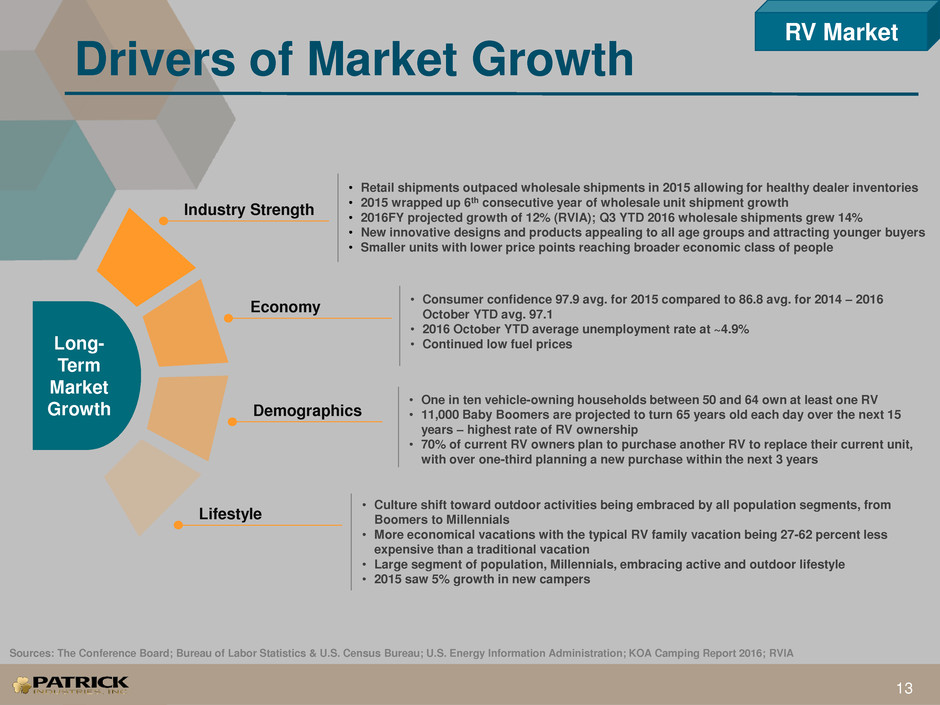
• Retail shipments outpaced wholesale shipments in 2015 allowing for healthy dealer inventories
• 2015 wrapped up 6th consecutive year of wholesale unit shipment growth
• 2016FY projected growth of 12% (RVIA); Q3 YTD 2016 wholesale shipments grew 14%
• New innovative designs and products appealing to all age groups and attracting younger buyers
• Smaller units with lower price points reaching broader economic class of people
• Consumer confidence 97.9 avg. for 2015 compared to 86.8 avg. for 2014 – 2016
October YTD avg. 97.1
• 2016 October YTD average unemployment rate at ~4.9%
• Continued low fuel prices
• One in ten vehicle-owning households between 50 and 64 own at least one RV
• 11,000 Baby Boomers are projected to turn 65 years old each day over the next 15
years – highest rate of RV ownership
• 70% of current RV owners plan to purchase another RV to replace their current unit,
with over one-third planning a new purchase within the next 3 years
• Culture shift toward outdoor activities being embraced by all population segments, from
Boomers to Millennials
• More economical vacations with the typical RV family vacation being 27-62 percent less
expensive than a traditional vacation
• Large segment of population, Millennials, embracing active and outdoor lifestyle
• 2015 saw 5% growth in new campers
Sources: The Conference Board; Bureau of Labor Statistics & U.S. Census Bureau; U.S. Energy Information Administration; KOA Camping Report 2016; RVIA
Industry Trends
14
9M-2016 Wholesale Shipments
Travel Trailer 65%
Fifth Wheel 19%
Camping Trailer 2%
Park Model 1%
Class A 5%
Class B & C 8%
Towables
87%
Motorized
13%
RV Market
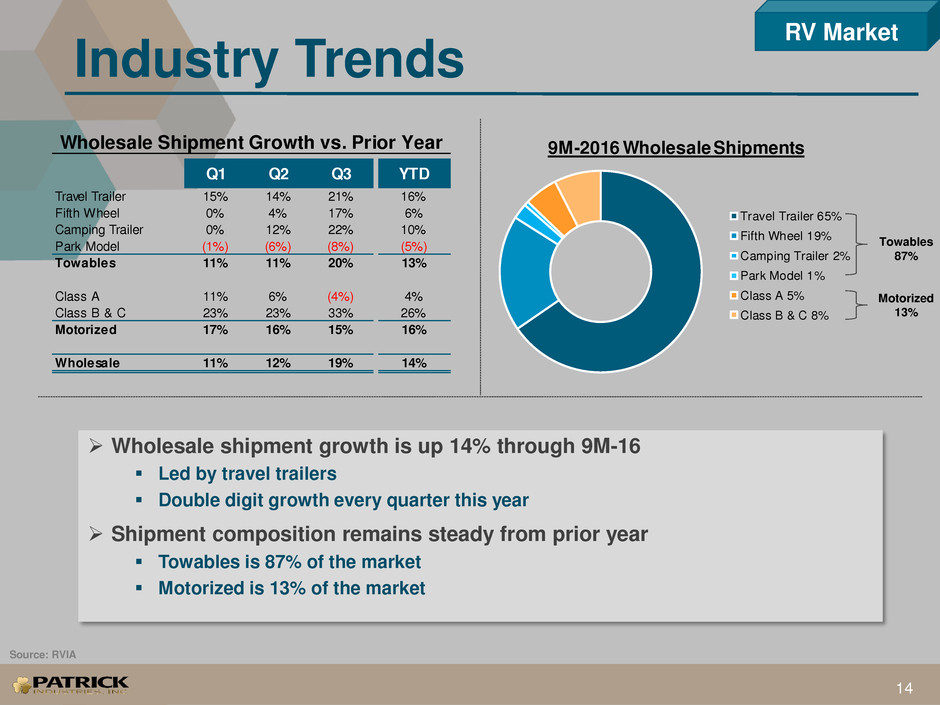
Wholesale shipment growth is up 14% through 9M-16
Led by travel trailers
Double digit growth every quarter this year
Shipment composition remains steady from prior year
Towables is 87% of the market
Motorized is 13% of the market
Source: RVIA
Wholesale Shipment Growth vs. Prior Year
Q1 Q2 Q3 YTD
Travel Trailer 15% 14% 21% 16%
Fifth Wheel 0% 4% 17% 6%
Camping Trailer 0% 12% 22% 10%
Park Model (1%) (6%) (8%) (5%)
Towables 11% 11% 20% 13%
Class A 11% 6% (4%) 4%
Class B & C 23% 23% 33% 26%
Motorized 17% 16% 15% 16%
Wholesale 11% 12% 19% 14%
Retail vs. Wholesale
15
RV Market
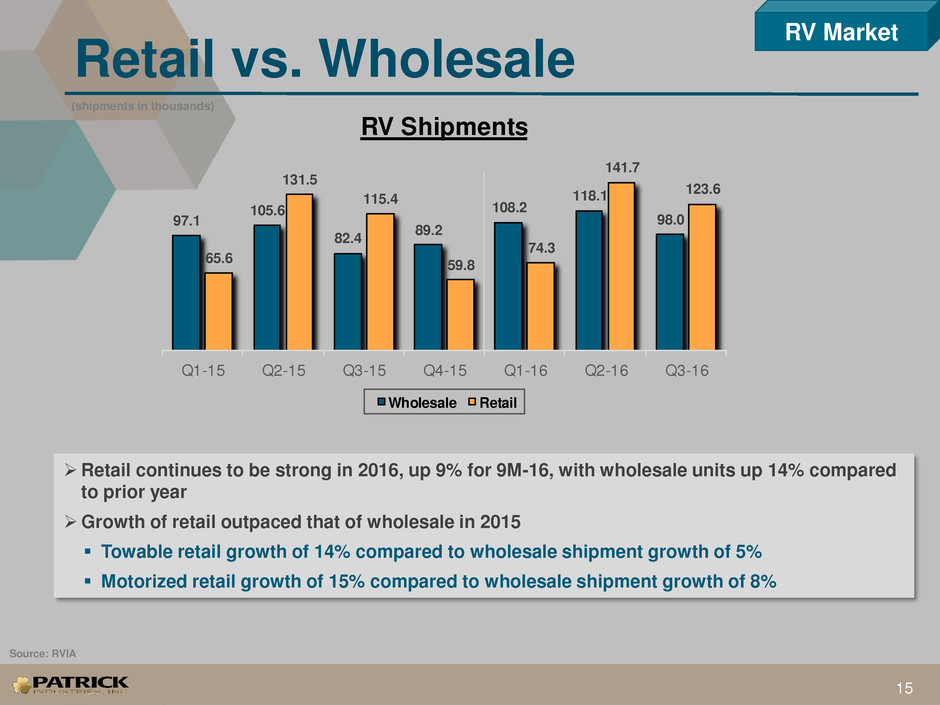
Retail continues to be strong in 2016, up 9% for 9M-16, with wholesale units up 14% compared
to prior year
Growth of retail outpaced that of wholesale in 2015
Towable retail growth of 14% compared to wholesale shipment growth of 5%
Motorized retail growth of 15% compared to wholesale shipment growth of 8%
97.1
105.6
82.4
89.2
108.2
118.1
98.0
65.6
131.5
115.4
59.8
74.3
141.7
123.6
Q1-15 Q2-15 Q3-15 Q4-15 Q1-16 Q2-16 Q3-16
RV Shipments
Wholesale Retail
Source: RVIA
(shipments in thousands)
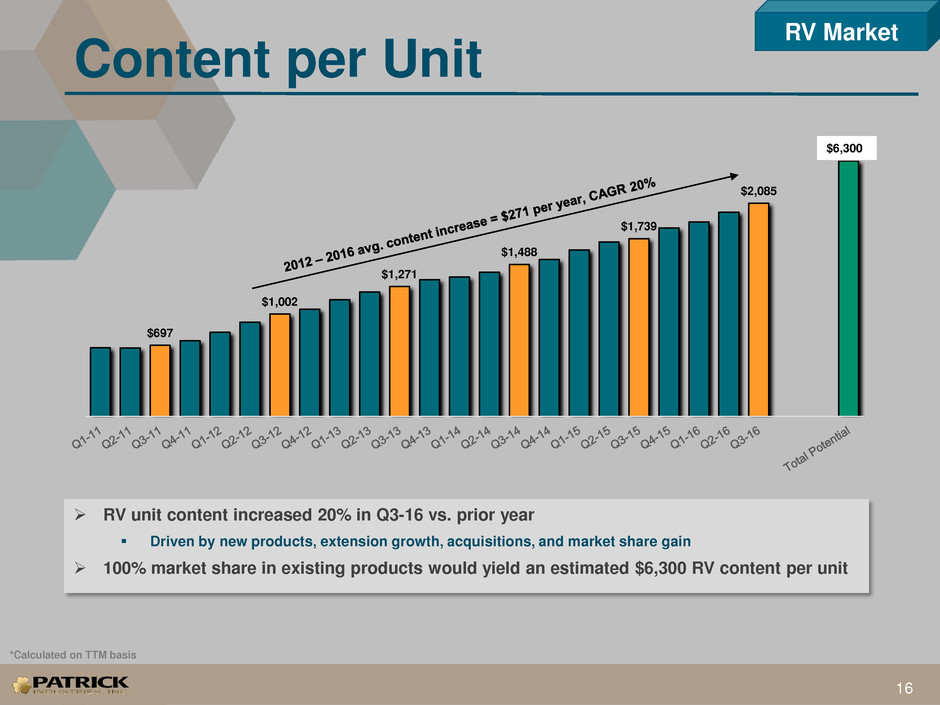
Content per Unit
16
RV Market
$697
$1,002
$1,271
$1,488
$1,739
$2,085
$5,600
RV unit content increased 20% in Q3-16 vs. prior year
Driven by new products, extension growth, acquisitions, and market share gain
100% market share in existing products would yield an estimated $6,300 RV content per unit
*Calculated on TTM basis
$6,300
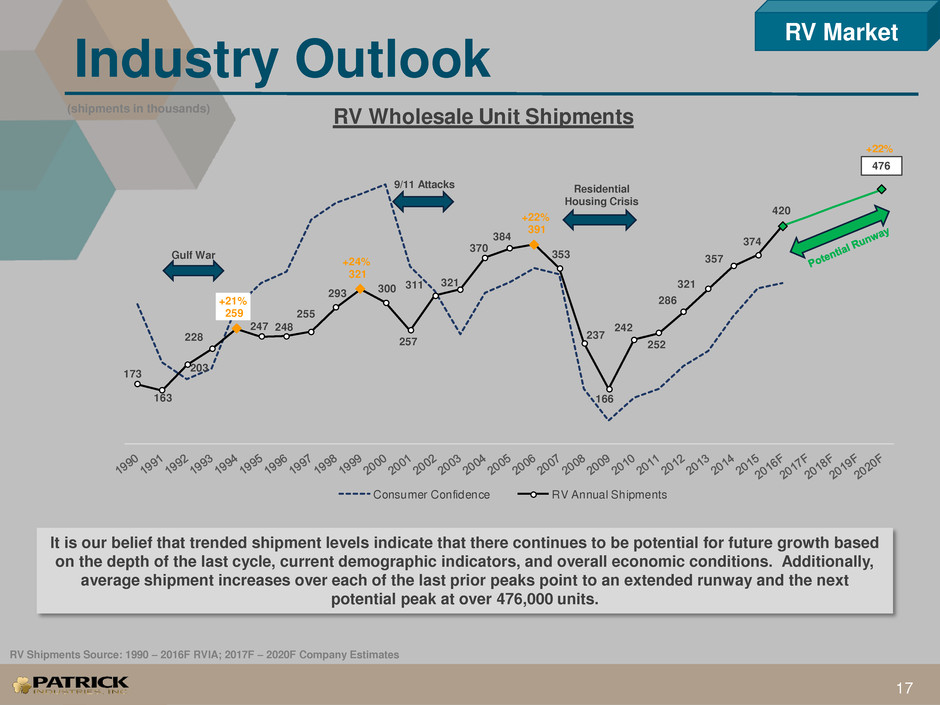
173
163
203
228
+21%
259
247 248
255
293
+24%
321
300
257
311 321
370
384
+22%
391
353
237
166
242
252
286
321
357
374
420
RV Wholesale Unit Shipments
Consumer Confidence RV Annual Shipments
476
Industry Outlook
17
Gulf War
9/11 Attacks Residential
Housing Crisis
It is our belief that trended shipment levels indicate that there continues to be potential for future growth based
on the depth of the last cycle, current demographic indicators, and overall economic conditions. Additionally,
average shipment increases over each of the last prior peaks point to an extended runway and the next
potential peak at over 476,000 units.
(shipments in thousands)
+22%
RV Shipments Source: 1990 – 2016F RVIA; 2017F – 2020F Company Estimates
RV Market

MH Market
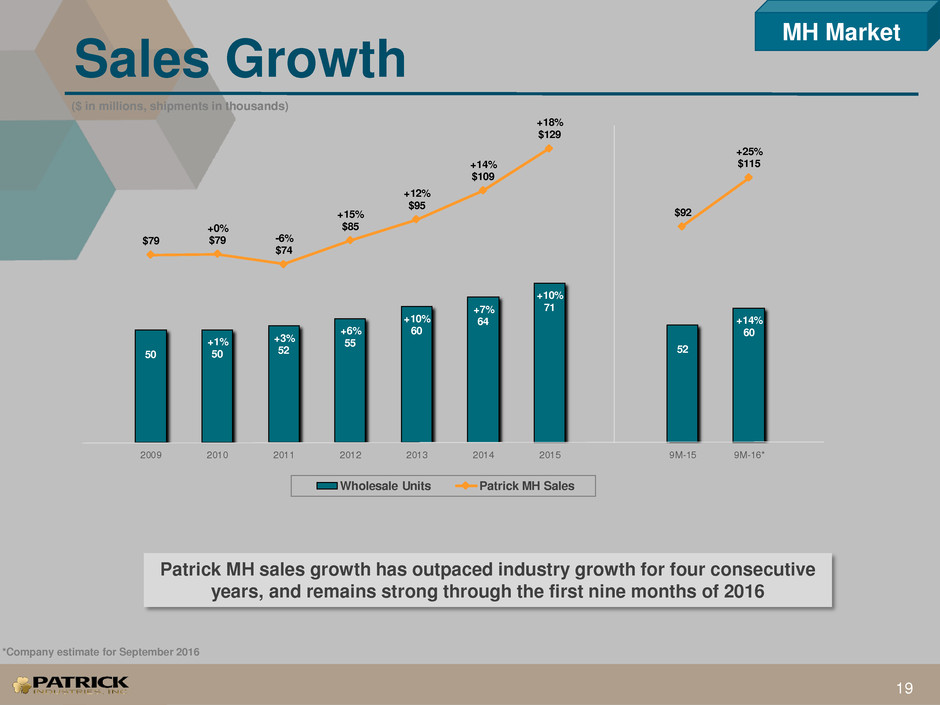
Sales Growth
19
MH Market
50
+1%
50
+3%
52
+6%
55
+10%
60
+7%
64
+10%
71
52
+14%
60
$79
+0%
$79 -6%
$74
+15%
$85
+12%
$95
+14%
$109
+18%
$129
$92
+25%
$115
2009 2010 2011 2012 2013 2014 2015 9M-15 9M-16*
Wholesale Units Patrick MH Sales
Patrick MH sales growth has outpaced industry growth for four consecutive
years, and remains strong through the first nine months of 2016
($ in millions, shipments in thousands)
*Company estimate for September 2016
Market Conditions & Consumer Trends
20
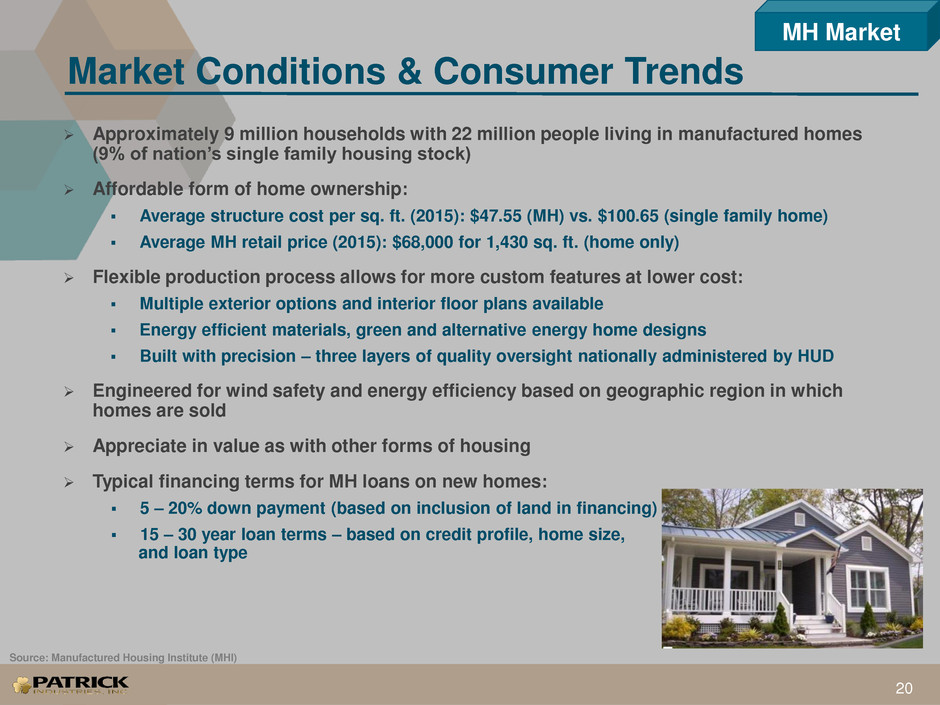
Approximately 9 million households with 22 million people living in manufactured homes
(9% of nation’s single family housing stock)
Affordable form of home ownership:
Average structure cost per sq. ft. (2015): $47.55 (MH) vs. $100.65 (single family home)
Average MH retail price (2015): $68,000 for 1,430 sq. ft. (home only)
Flexible production process allows for more custom features at lower cost:
Multiple exterior options and interior floor plans available
Energy efficient materials, green and alternative energy home designs
Built with precision – three layers of quality oversight nationally administered by HUD
Engineered for wind safety and energy efficiency based on geographic region in which
homes are sold
Appreciate in value as with other forms of housing
Typical financing terms for MH loans on new homes:
5 – 20% down payment (based on inclusion of land in financing)
15 – 30 year loan terms – based on credit profile, home size,
and loan type
Source: Manufactured Housing Institute (MHI)
MH Market
Market Indicators
21
Long-
Term
Market
Growth
Quality
credit
standards
Number of
aging “Baby
Boomers”
Tax
incentives
Alternative
housing
availability
Consumer
Demand
Financing/
credit
availability
Dealer and
manufacturer
inventory
levels
Affordability
and quality
Consumer
confidence
Drivers of Consumer Demand Market Growth
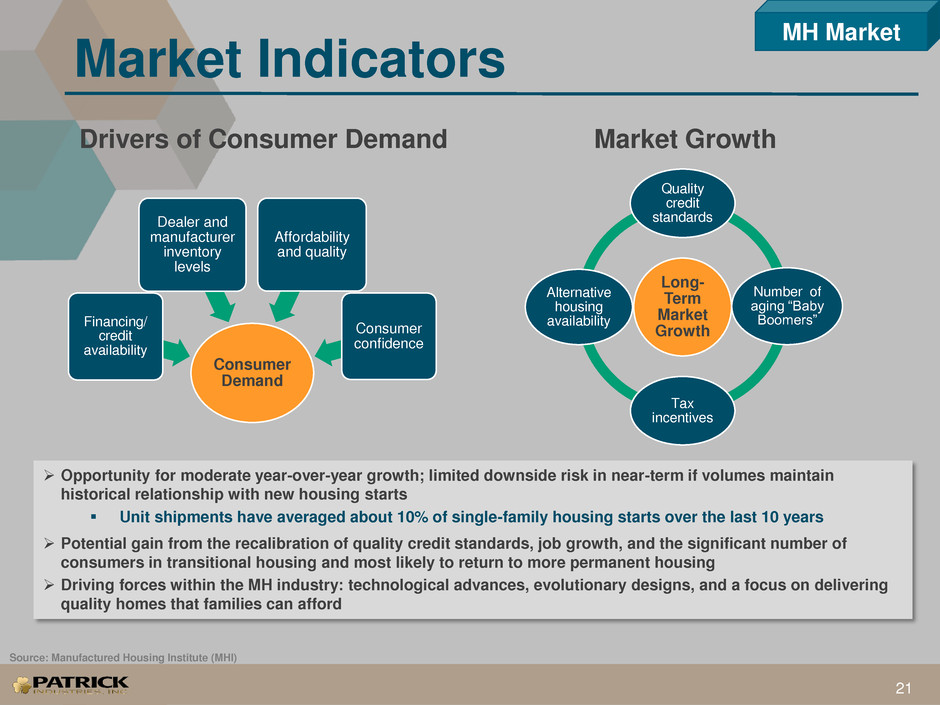
Opportunity for moderate year-over-year growth; limited downside risk in near-term if volumes maintain
historical relationship with new housing starts
Unit shipments have averaged about 10% of single-family housing starts over the last 10 years
Potential gain from the recalibration of quality credit standards, job growth, and the significant number of
consumers in transitional housing and most likely to return to more permanent housing
Driving forces within the MH industry: technological advances, evolutionary designs, and a focus on delivering
quality homes that families can afford
Source: Manufactured Housing Institute (MHI)
MH Market
Content per Unit
22
MH Market
$1,500 $1,498
$1,599 $1,614
$1,820
$1,911
$6,200
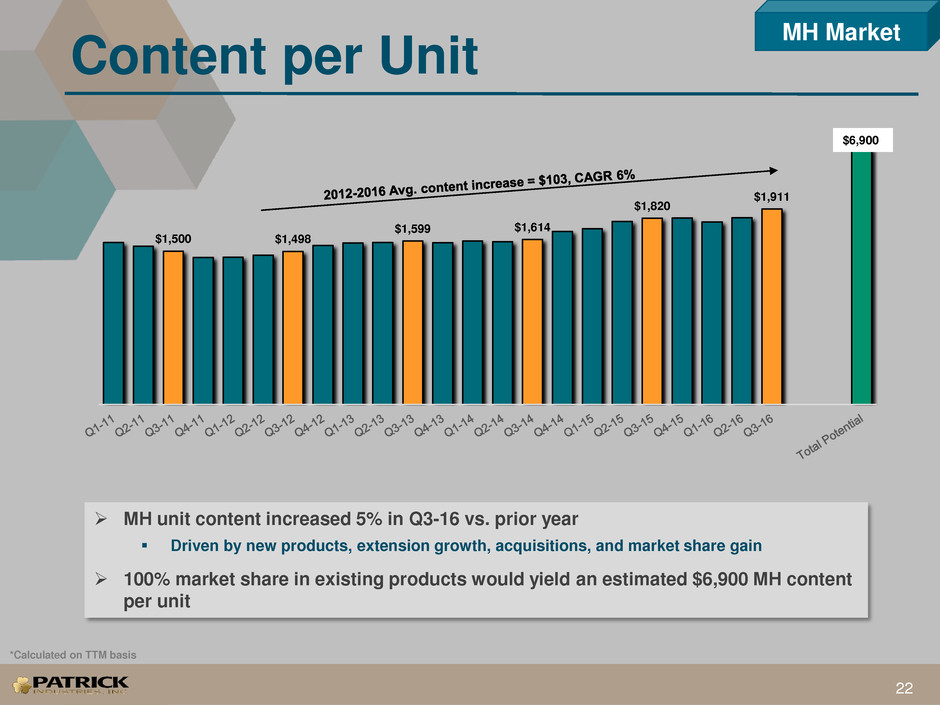
MH unit content increased 5% in Q3-16 vs. prior year
Driven by new products, extension growth, acquisitions, and market share gain
100% market share in existing products would yield an estimated $6,900 MH content
per unit
*Calculated on TTM basis
$6,900
193
168
131 131
147
118
96
82
50 50 52 55
60 64
71
80
MH Wholesale Unit Shipments
Industry Outlook
23
Source: 1990-2015: Manufactured Housing Institute (MHI); 2016F Company Estimate
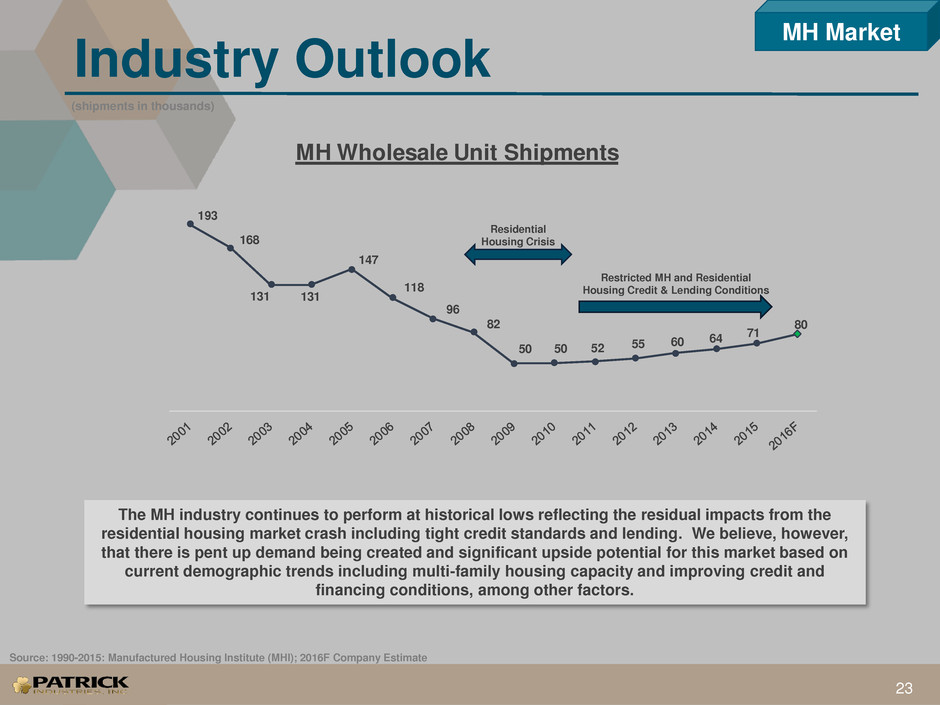
The MH industry continues to perform at historical lows reflecting the residual impacts from the
residential housing market crash including tight credit standards and lending. We believe, however,
that there is pent up demand being created and significant upside potential for this market based on
current demographic trends including multi-family housing capacity and improving credit and
financing conditions, among other factors.
Residential
Housing Crisis
Restricted MH and Residential
Housing Credit & Lending Conditions
(shipments in thousands)
Needs updatingMH Marke

Industrial Market
Sales Growth
25
Industrial Market
554
+6%
587
+4%
609
+28%
781
+18%
925
+8%
1,003
+11%
1,112
853
+4%
884
$40
-4%
$39
+19%
$46
+13%
$52
+33%
$70
+13%
$79
+28%
$101
$75
+46%
$109
2009 2010 2011 2012 2013 2014 2015 9M-15 9M-16
Residential Housing Starts Patrick Industrial Sales
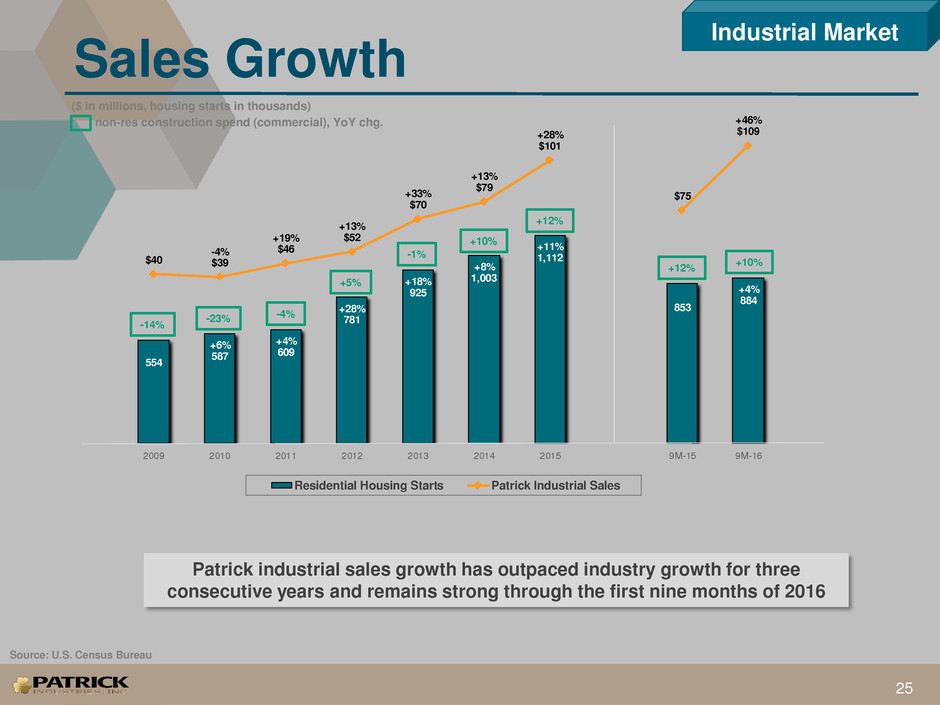
Patrick industrial sales growth has outpaced industry growth for three
consecutive years and remains strong through the first nine months of 2016
($ in millions, housing starts in thousands)
-14%
-23% -4%
+5%
-1%
+10%
+12%
non-res construction spend (commercial), YoY chg.
+10%
+12%
Source: U.S. Census Bureau
Industry Conditions
26
Industrial Market
Residential
Housing
50%
Commercial &
Institutional
Fixtures
50%
Q3-2016 Sales Composition
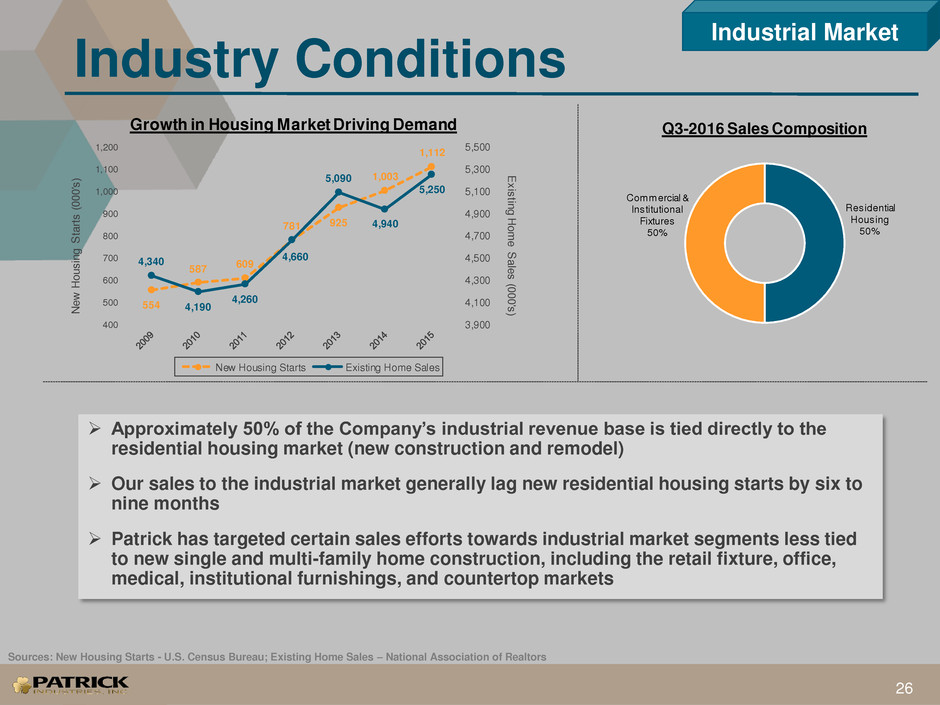
Approximately 50% of the Company’s industrial revenue base is tied directly to the
residential housing market (new construction and remodel)
Our sales to the industrial market generally lag new residential housing starts by six to
nine months
Patrick has targeted certain sales efforts towards industrial market segments less tied
to new single and multi-family home construction, including the retail fixture, office,
medical, institutional furnishings, and countertop markets
Sources: New Housing Starts - U.S. Census Bureau; Existing Home Sales – National Association of Realtors
554
587 609
781 925
1,003
1,112
4,340
4,190
4,260
4,660
5,090
4,940
5,250
3,900
4,100
4,300
4,500
4,700
4,900
5,100
5,300
5,500
400
500
600
700
800
900
1,000
1,100
1,200
Existing Hom
e Sales (000's)Ne
w
Ho
us
ing
S
ta
rts
(0
00
's)
Growth in Housing Market Driving Demand
New Housing Starts Existing Home Sales
Industry Outlook
27
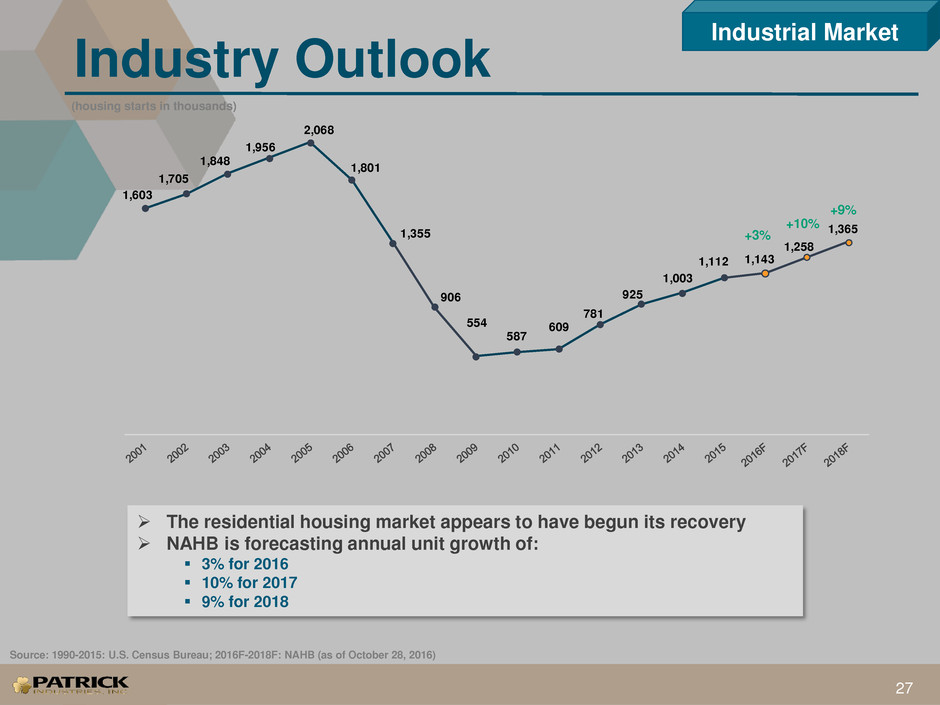
The residential housing market appears to have begun its recovery
NAHB is forecasting annual unit growth of:
3% for 2016
10% for 2017
9% for 2018
Source: 1990-2015: U.S. Census Bureau; 2016F-2018F: NAHB (as of October 28, 2016)
(housing starts in thousands)
Industrial Market
1,603
1,705
1,848
1,956
2,068
1,801
1,355
906
554
587
609
781
925
1,003
1,112 1,143
1,258
1,365
+3%
+10%
+9%

Strategy Execution
Debt Reduction
and Leverage
Position
Capital Allocation Strategy
29
Acquisitions
Geographic and
Product
Expansion
Stock Buyback
Program
Investments in
Infrastructure
and Capital
Expenditures
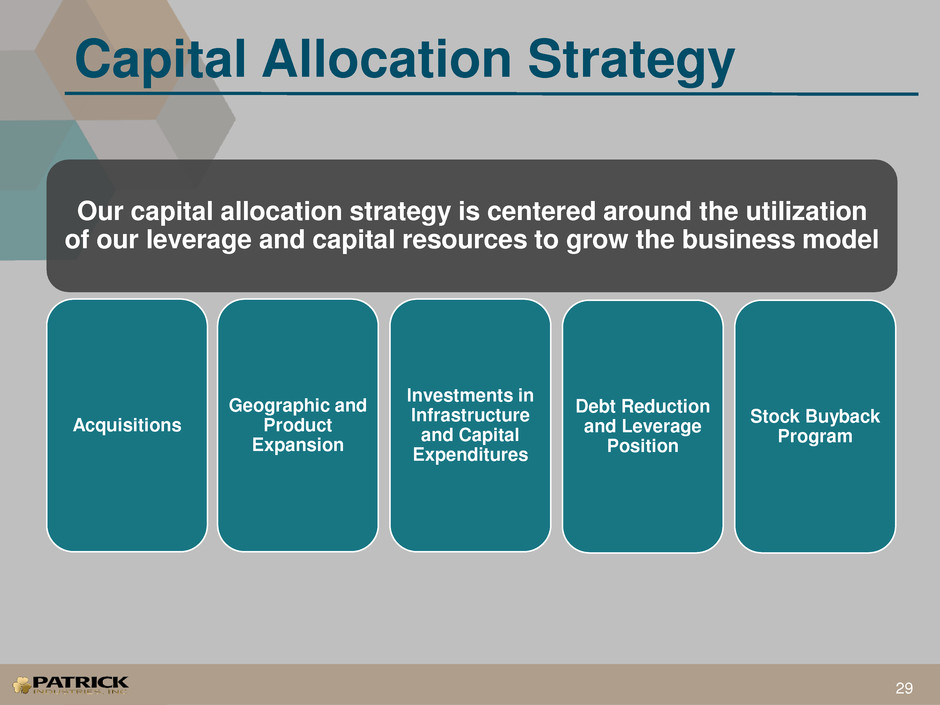
Our capital allocation strategy is centered around the utilization
of our leverage and capital resources to grow the business model
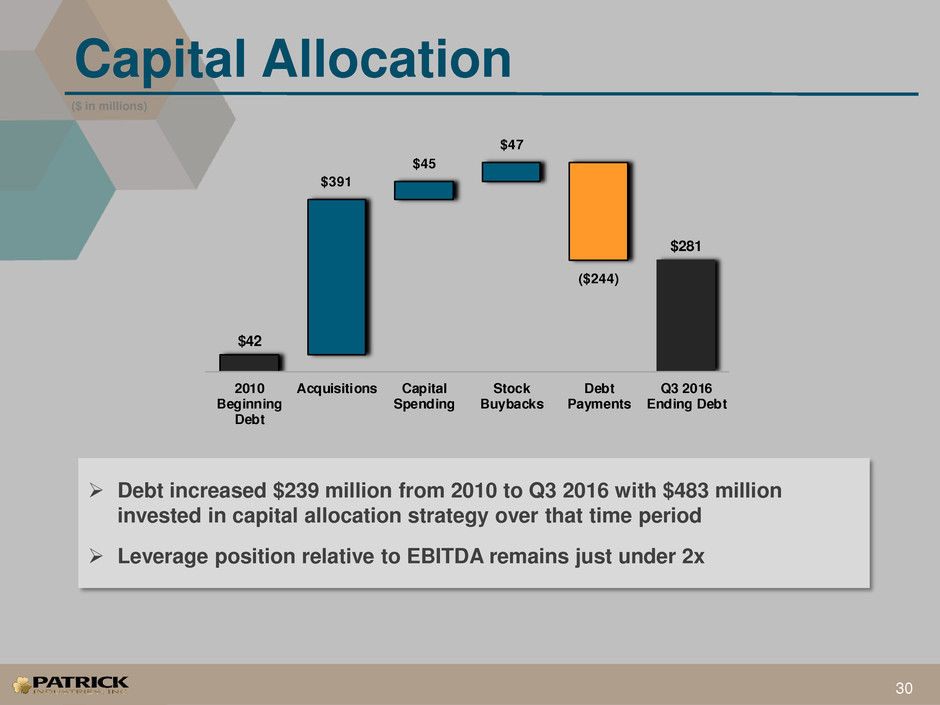
Debt increased $239 million from 2010 to Q3 2016 with $483 million
invested in capital allocation strategy over that time period
Leverage position relative to EBITDA remains just under 2x
Capital Allocation
30
($ in millions)
$42
$281
$391
$45
$47
($244)
2010
Beginning
Debt
Acquisitions Capital
Spending
Stock
Buybacks
Debt
Payments
Q3 2016
Ending Debt
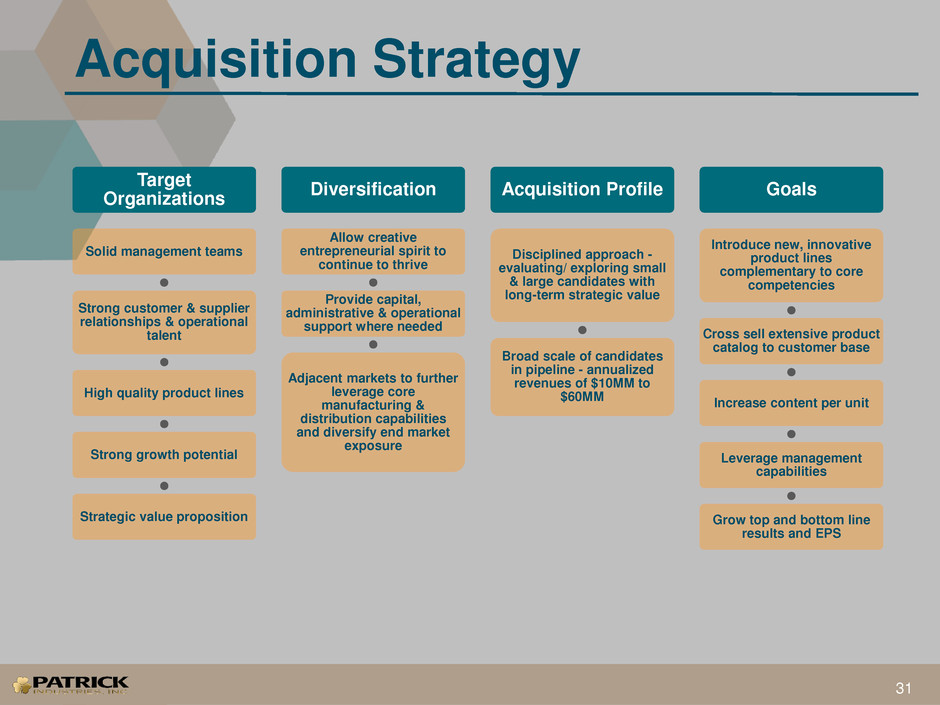
Acquisition Strategy
Target
Organizations
Solid management teams
Strong customer & supplier
relationships & operational
talent
High quality product lines
Strong growth potential
Strategic value proposition
Diversification
Allow creative
entrepreneurial spirit to
continue to thrive
Provide capital,
administrative & operational
support where needed
Adjacent markets to further
leverage core
manufacturing &
distribution capabilities
and diversify end market
exposure
Acquisition Profile
Disciplined approach -
evaluating/ exploring small
& large candidates with
long-term strategic value
Broad scale of candidates
in pipeline - annualized
revenues of $10MM to
$60MM
Goals
Introduce new, innovative
product lines
complementary to core
competencies
Cross sell extensive product
catalog to customer base
Increase content per unit
Leverage management
capabilities
Grow top and bottom line
results and EPS
31
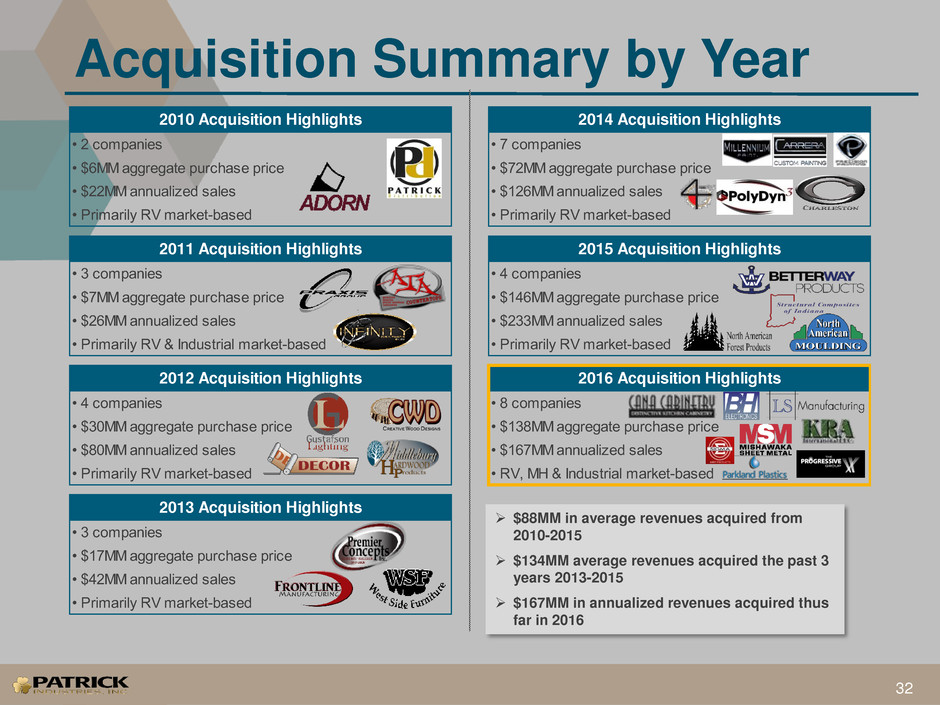
2010 Acquisition Highlights 2014 Acquisition Highlights
• 2 companies • 7 companies
• $6MM aggregate purchase price • $72MM aggregate purchase price
• $22MM annualized sales • $126MM annualized sales
• Primarily RV market-based • Primarily RV market-based
2011 Acquisition Highlights 2015 Acquisition Highlights
• 3 companies • 4 companies
• $7MM aggregate purchase price • $146MM aggregate purchase price
• $26MM annualized sales • $233MM annualized sales
• Primarily RV & Industrial market-based • Primarily RV market-based
2012 Acquisition Highlights 2016 Acquisition Highlights
• 4 companies • 8 companies
• $30MM aggregate purchase price • $138MM aggregate purchase price
• $80MM annualized sales • $167MM annualized sales
• Primarily RV market-based • RV, MH & Industrial market-based
2013 Acquisition Highlights
• 3 companies
• $17MM aggregate purchase price
• $42MM annualized sales
• Primarily RV market-based
Acquisition Summary by Year
32
$88MM in average revenues acquired from
2010-2015
$134MM average revenues acquired the past 3
years 2013-2015
$167MM in annualized revenues acquired thus
far in 2016
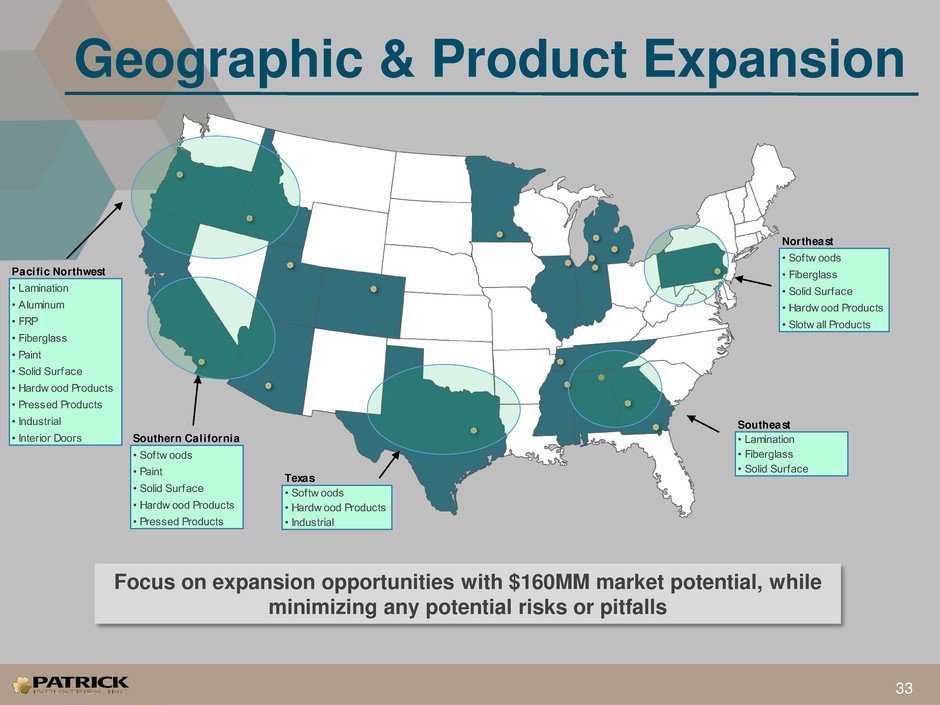
Northeast
• Softw oods
• Fiberglass
• Solid Surface
• Hardw ood Products
• Slotw all Products
Southeast
• Lamination
• Fiberglass
• Solid Surface
Texas
• Softw oods
• Hardw ood Products
• Industrial
Southern California
• Softw oods
• Paint
• Solid Surface
• Hardw ood Products
• Pressed Products
Pacific Northwest
• Lamination
• Aluminum
• FRP
• Fiberglass
• Paint
• Solid Surface
• Hardw ood Products
• Pressed Products
• Industrial
• Interior Doors
33
Geographic & Product Expansion
Focus on expansion opportunities with $160MM market potential, while
minimizing any potential risks or pitfalls
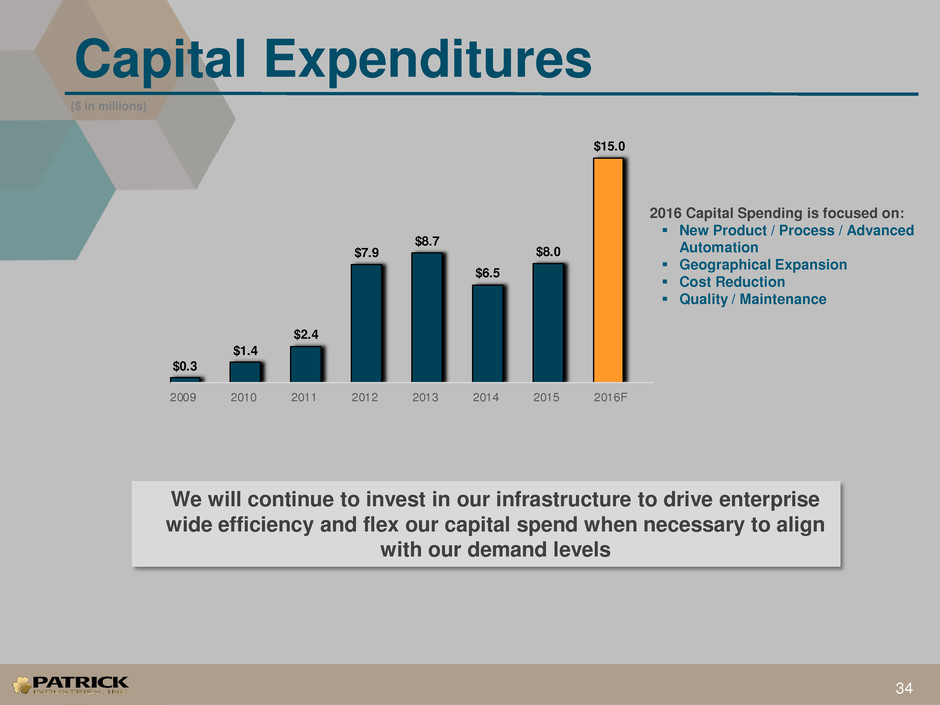
Capital Expenditures
34
We will continue to invest in our infrastructure to drive enterprise
wide efficiency and flex our capital spend when necessary to align
with our demand levels
($ in millions)
$0.3
$1.4
$2.4
$7.9
$8.7
$6.5
$8.0
$15.0
2009 2010 2011 2012 2013 2014 2015 2016F
2016 Capital Spending is focused on:
New Product / Process / Advanced
Automation
Geographical Expansion
Cost Reduction
Quality / Maintenance
Stock Buyback
35
388 223
- -
142 117
258 196
- -
423
71 40 -
$63.09*
$9.18 $9.95 $9.95 $9.95 $9.95
$12.97
$14.95
$17.73
$19.38 $19.38 $19.38
$24.41 $25.04 $25.47 $25.47
0
200
400
600
800
1,000
1,200
1,400
1,600
1,800
2,000
Q4-12 Q1-13 Q2-13 Q3-13 Q4-13 Q1-14 Q2-14 Q3-14 Q4-14 Q1-15 Q2-15 Q3-15 Q4-15 Q1-16 Q2-16 Q3-16
$0.00
$10.00
$20.00
$30.00
$40.00
$50.00
$60.00
Sto
ck
Bu
yb
ac
k (
00
0's
)
Stock Price
Incremental Shares Repurchased Cumulative Shares Repurchased Avg. Close Share Price Cumulative Avg. Price of Share Buyback
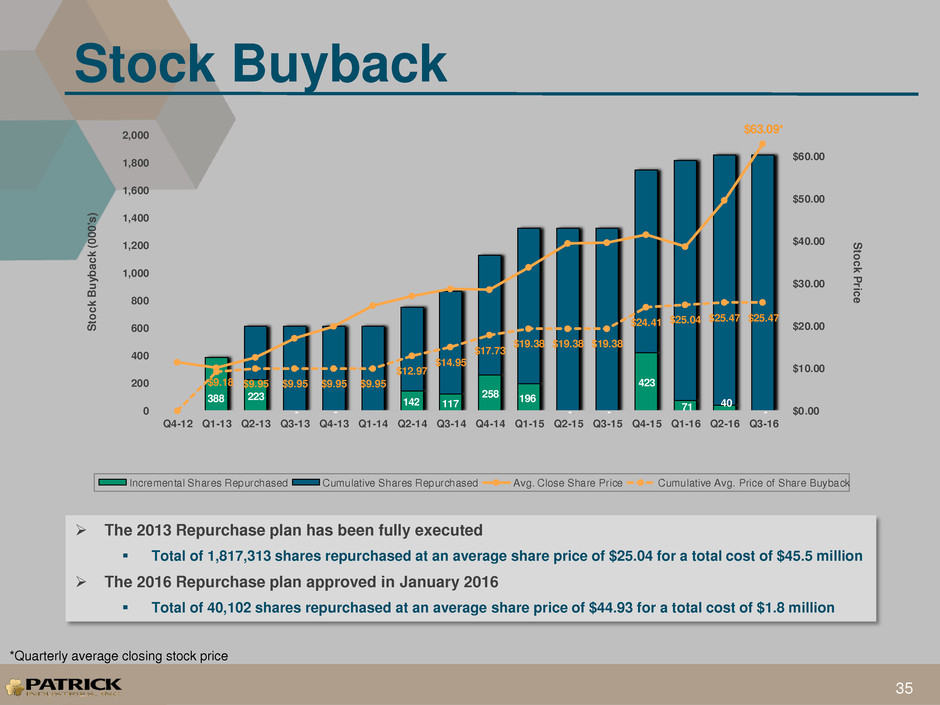
*Quarterly average closing stock price
The 2013 Repurchase plan has been fully executed
Total of 1,817,313 shares repurchased at an average share price of $25.04 for a total cost of $45.5 million
The 2016 Repurchase plan approved in January 2016
Total of 40,102 shares repurchased at an average share price of $44.93 for a total cost of $1.8 million
$28.93
$43.98
$19.29
$29.32
$43.50
$71.35
12/31/13 12/31/14 12/31/15 11/30/16
Pre-Stock Split Close Price Post-Stock Split Close Price
Stock Performance
36
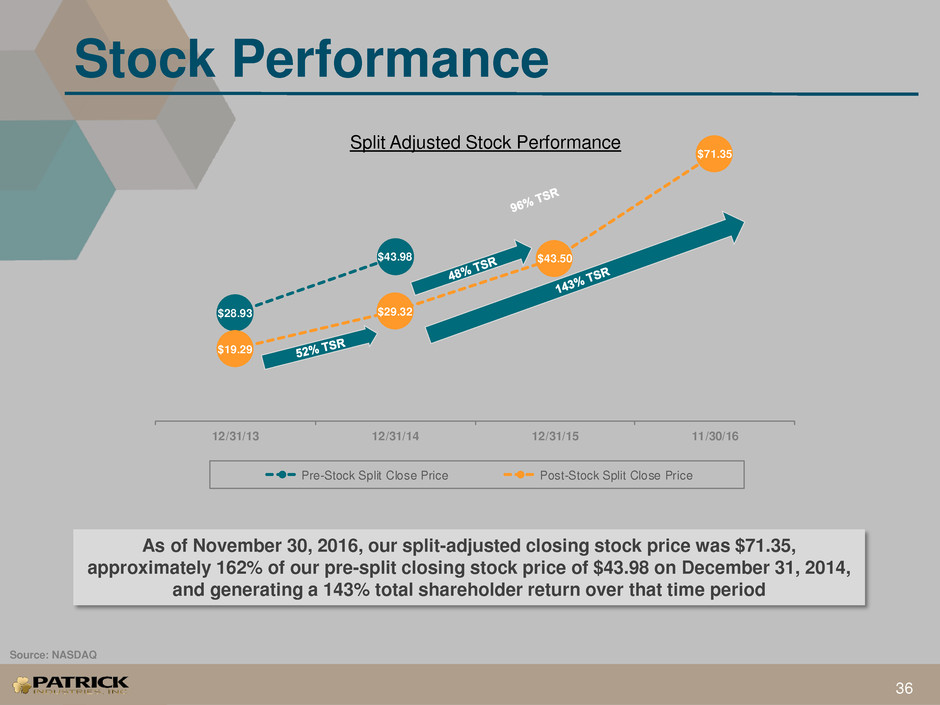
As of November 30, 2016, our split-adjusted closing stock price was $71.35,
approximately 162% of our pre-split closing stock price of $43.98 on December 31, 2014,
and generating a 143% total shareholder return over that time period
Split Adjusted Stock Performance
Source: NASDAQ
37
PATK Highlights
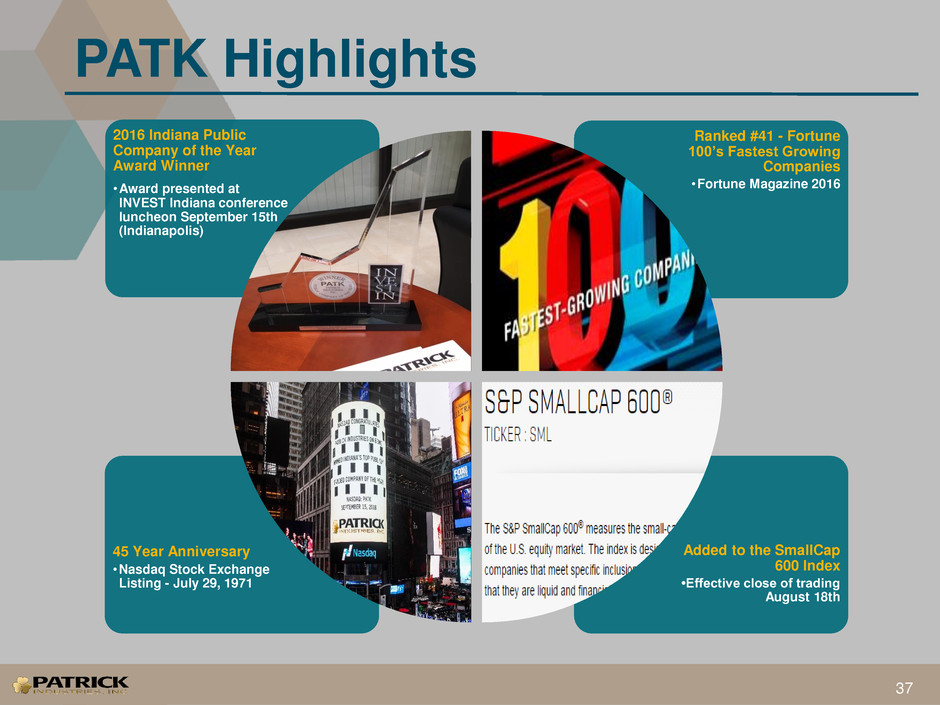
Added to the SmallCap
600 Index
•Effective close of trading
August 18th
45 Year Anniversary
•Nasdaq Stock Exchange
Listing - July 29, 1971
Ranked #41 - Fortune
100’s Fastest Growing
Companies
•Fortune Magazine 2016
2016 Indiana Public
Company of the Year
Award Winner
•Award presented at
INVEST Indiana conference
luncheon September 15th
(Indianapolis)
Why Patrick Industries
38
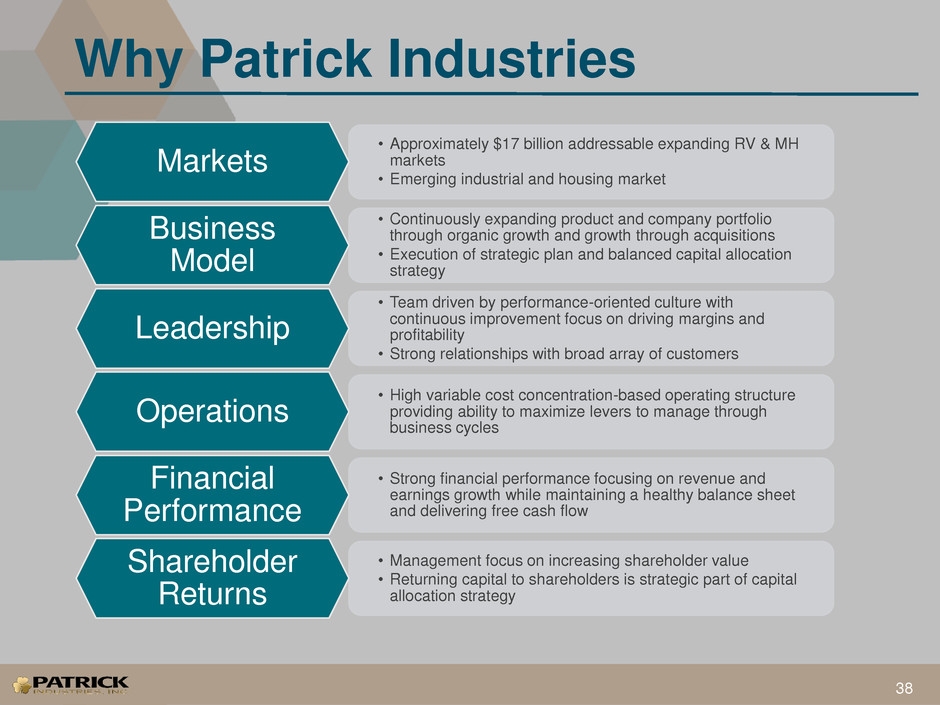
• Approximately $17 billion addressable expanding RV & MH
markets
• Emerging industrial and housing market
Markets
• Continuously expanding product and company portfolio
through organic growth and growth through acquisitions
• Execution of strategic plan and balanced capital allocation
strategy
Business
Model
• Team driven by performance-oriented culture with
continuous improvement focus on driving margins and
profitability
• Strong relationships with broad array of customers
Leadership
• High variable cost concentration-based operating structure
providing ability to maximize levers to manage through
business cycles
Operations
• Strong financial performance focusing on revenue and
earnings growth while maintaining a healthy balance sheet
and delivering free cash flow
Financial
Performance
• Management focus on increasing shareholder value
• Returning capital to shareholders is strategic part of capital
allocation strategy
Shareholder
Returns

Appendix
Balance Sheet Strength
40
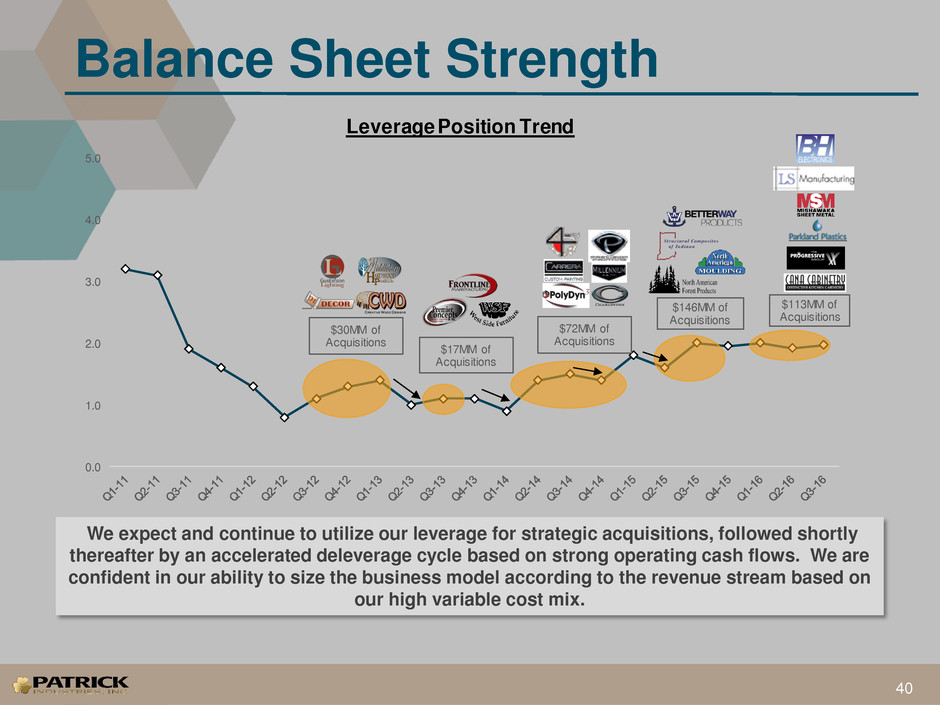
We expect and continue to utilize our leverage for strategic acquisitions, followed shortly
thereafter by an accelerated deleverage cycle based on strong operating cash flows. We are
confident in our ability to size the business model according to the revenue stream based on
our high variable cost mix.
0.0
1.0
2.0
3.0
4.0
5.0
Leverage Position Trend
$30MM of
Acquisitions
$17MM of
Acquisitions
$72MM of
Acquisitions
$146MM of
Acquisitions
$113MM of
Acquisitions
0
100,000
200,000
300,000
400,000
500,000
600,000
700,000
0.00
10.00
20.00
30.00
40.00
50.00
60.00
70.00
80.00
Jan-16 Feb-16 Mar-16 Apr-16 May-16 Jun-16 Jul-16 Aug-16 Sep-16 Oct-16 Nov-16
Patrick Stock Price and Volume
Volume Price Close
Shareholder Value
41
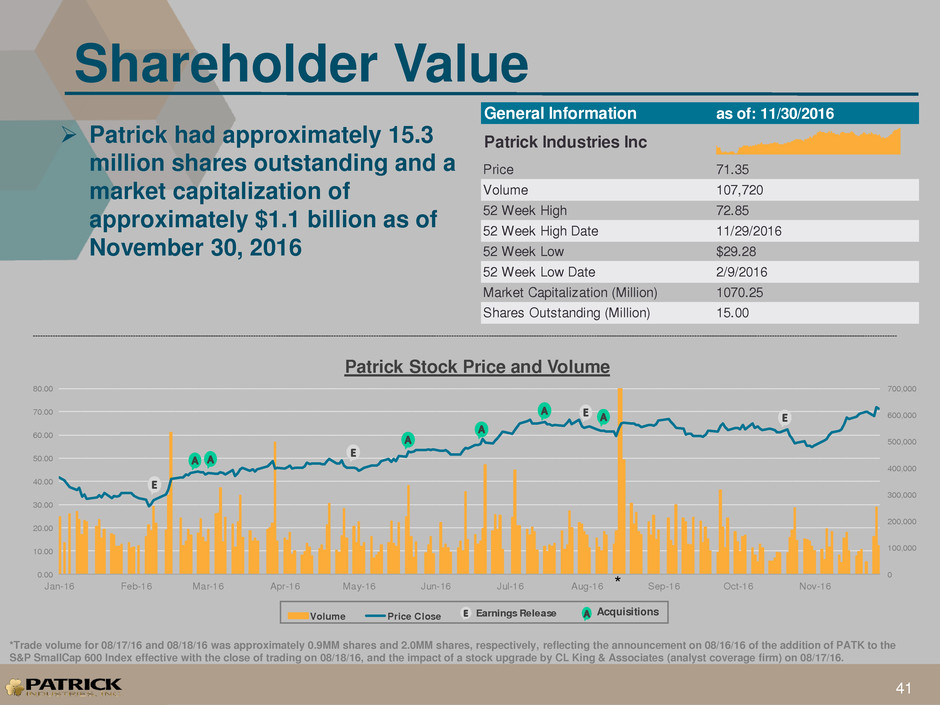
Patrick had approximately 15.3
million shares outstanding and a
market capitalization of
approximately $1.1 billion as of
November 30, 2016
Earnings Release
Acquisitions
*
*Trade volume for 08/17/16 and 08/18/16 was approximately 0.9MM shares and 2.0MM shares, respectively, reflecting the announcement on 08/16/16 of the addition of PATK to the
S&P SmallCap 600 Index effective with the close of trading on 08/18/16, and the impact of a stock upgrade by CL King & Associates (analyst coverage firm) on 08/17/16.
General Information as of: 11/30/2016
Patrick Industries Inc
Price 71.35
Volume 107,720
52 Week High 72.85
52 Week High Date 11/29/2016
52 Week Low $29.28
52 Week Low Date 2/9/2016
Market Capitalization (Million) 1070.25
Shares Outstanding (Million) 15.00
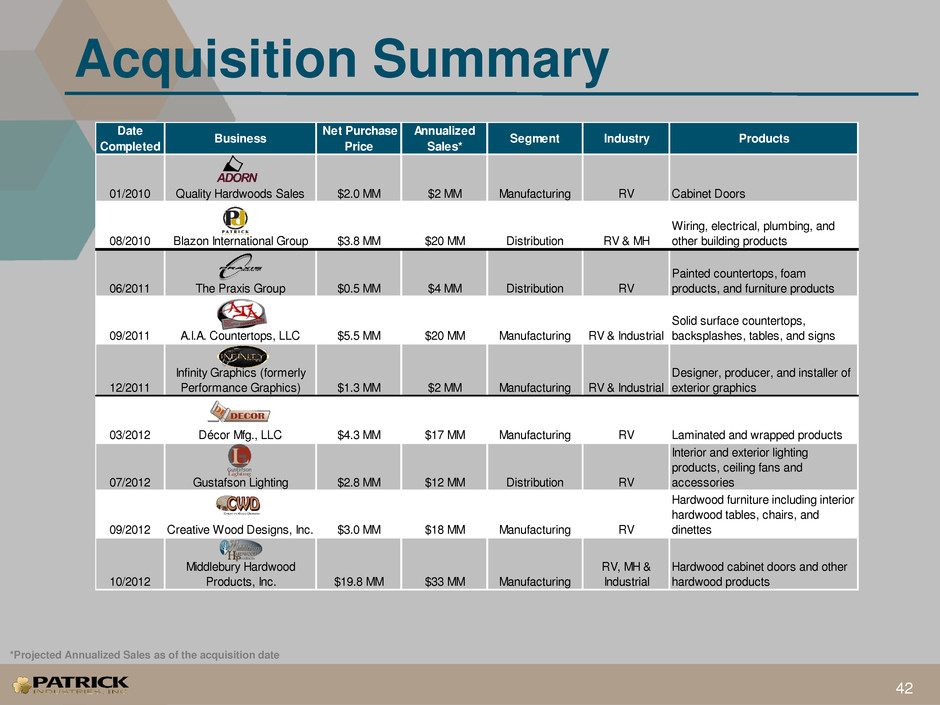
Date
Completed
Business
Net Purchase
Price
Annualized
Sales*
Segment Industry Products
01/2010 Quality Hardwoods Sales $2.0 MM $2 MM Manufacturing RV Cabinet Doors
08/2010 Blazon International Group $3.8 MM $20 MM Distribution RV & MH
Wiring, electrical, plumbing, and
other building products
06/2011 The Praxis Group $0.5 MM $4 MM Distribution RV
Painted countertops, foam
products, and furniture products
09/2011 A.I.A. Countertops, LLC $5.5 MM $20 MM Manufacturing RV & Industrial
Solid surface countertops,
backsplashes, tables, and signs
12/2011
Infinity Graphics (formerly
Performance Graphics) $1.3 MM $2 MM Manufacturing RV & Industrial
Designer, producer, and installer of
exterior graphics
03/2012 Décor Mfg., LLC $4.3 MM $17 MM Manufacturing RV Laminated and wrapped products
07/2012 Gustafson Lighting $2.8 MM $12 MM Distribution RV
Interior and exterior lighting
products, ceiling fans and
accessories
09/2012 Creative Wood Designs, Inc. $3.0 MM $18 MM Manufacturing RV
Hardwood furniture including interior
hardwood tables, chairs, and
dinettes
10/2012
Middlebury Hardwood
Products, Inc. $19.8 MM $33 MM Manufacturing
RV, MH &
Industrial
Hardwood cabinet doors and other
hardwood products
Acquisition Summary
42
*Projected Annualized Sales as of the acquisition date
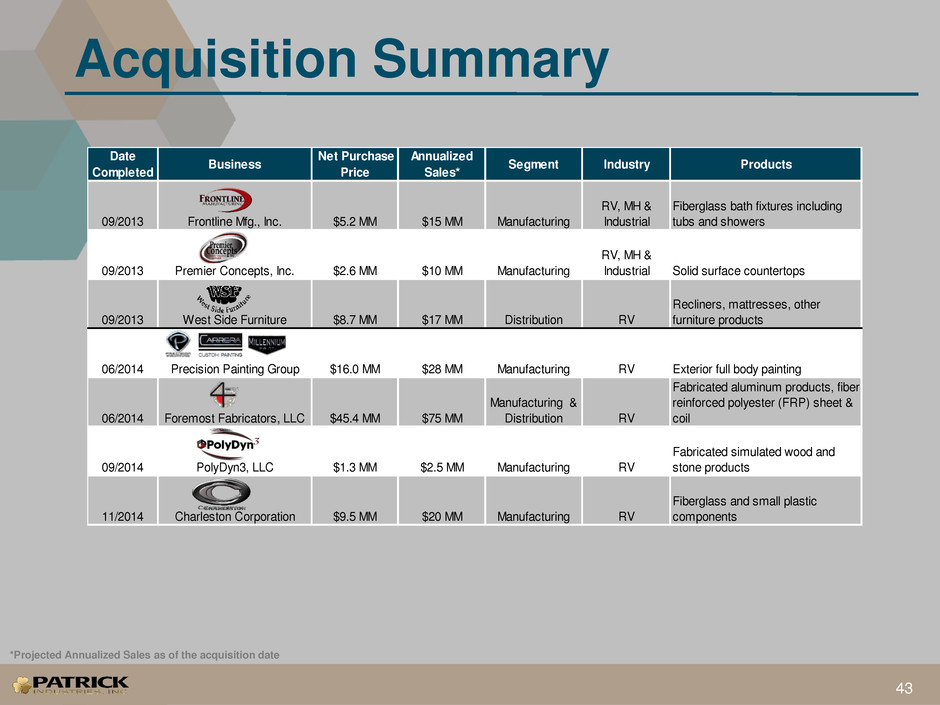
Date
Completed
Business
Net Purchase
Price
Annualized
Sales*
Segment Industry Products
09/2013 Frontline Mfg., Inc. $5.2 MM $15 MM Manufacturing
RV, MH &
Industrial
Fiberglass bath fixtures including
tubs and showers
09/2013 Premier Concepts, Inc. $2.6 MM $10 MM Manufacturing
RV, MH &
Industrial Solid surface countertops
09/2013 West Side Furniture $8.7 MM $17 MM Distribution RV
Recliners, mattresses, other
furniture products
06/2014 Precision Painting Group $16.0 MM $28 MM Manufacturing RV Exterior full body painting
06/2014 Foremost Fabricators, LLC $45.4 MM $75 MM
Manufacturing &
Distribution RV
Fabricated aluminum products, fiber
reinforced polyester (FRP) sheet &
coil
09/2014 PolyDyn3, LLC $1.3 MM $2.5 MM Manufacturing RV
Fabricated simulated wood and
stone products
11/2014 Charleston Corporation $9.5 MM $20 MM Manufacturing RV
Fiberglass and small plastic
components
Acquisition Summary
43
*Projected Annualized Sales as of the acquisition date
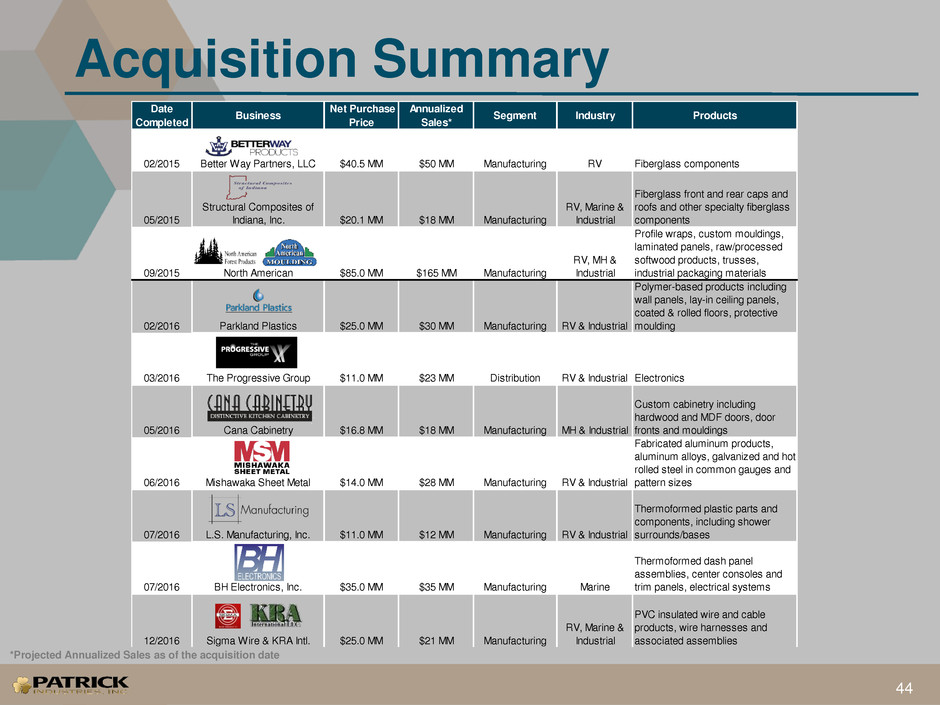
Acquisition Summary
44
*Projected Annualized Sales as of the acquisition date
Date
Completed
Business
Net Purchase
Price
Annualized
Sales*
Segment Industry Products
02/2015 Better Way Partners, LLC $40.5 MM $50 MM Manufacturing RV Fiberglass components
05/2015
Structural Composites of
Indiana, Inc. $20.1 MM $18 MM Manufacturing
RV, Marine &
Industrial
Fiberglass front and rear caps and
roofs and other specialty fiberglass
components
09/2015 North American $85.0 MM $165 MM Manufacturing
RV, MH &
Industrial
Profile wraps, custom mouldings,
laminated panels, raw/processed
softwood products, trusses,
industrial packaging materials
02/2016 Parkland Plastics $25.0 MM $30 MM Manufacturing RV & Industrial
Polymer-based products including
wall panels, lay-in ceiling panels,
coated & rolled floors, protective
moulding
03/2016 The Progressive Group $11.0 MM $23 MM Distribution RV & Industrial Electronics
05/2016 Cana Cabinetry $16.8 MM $18 MM Manufacturing MH & Industrial
Custom cabinetry including
hardwood and MDF doors, door
fronts and mouldings
06/2016 Mishawaka Sheet Metal $14.0 MM $28 MM Manufacturing RV & Industrial
Fabricated aluminum products,
aluminum alloys, galvanized and hot
rolled steel in common gauges and
pattern sizes
07/2016 L.S. Manufacturing, Inc. $11.0 MM $12 MM Manufacturing RV & Industrial
Thermoformed plastic parts and
components, including shower
surrounds/bases
07/2016 BH Electronics, Inc. $35.0 MM $35 MM Manufacturing Marine
Thermoformed dash panel
assemblies, center consoles and
trim panels, electrical systems
12/2016 Sigma Wire & KRA Intl. $25.0 MM $21 MM Manufacturing
RV, Marine &
Industrial
PVC insulated wire and cable
products, wire harnesses and
associated assemblies
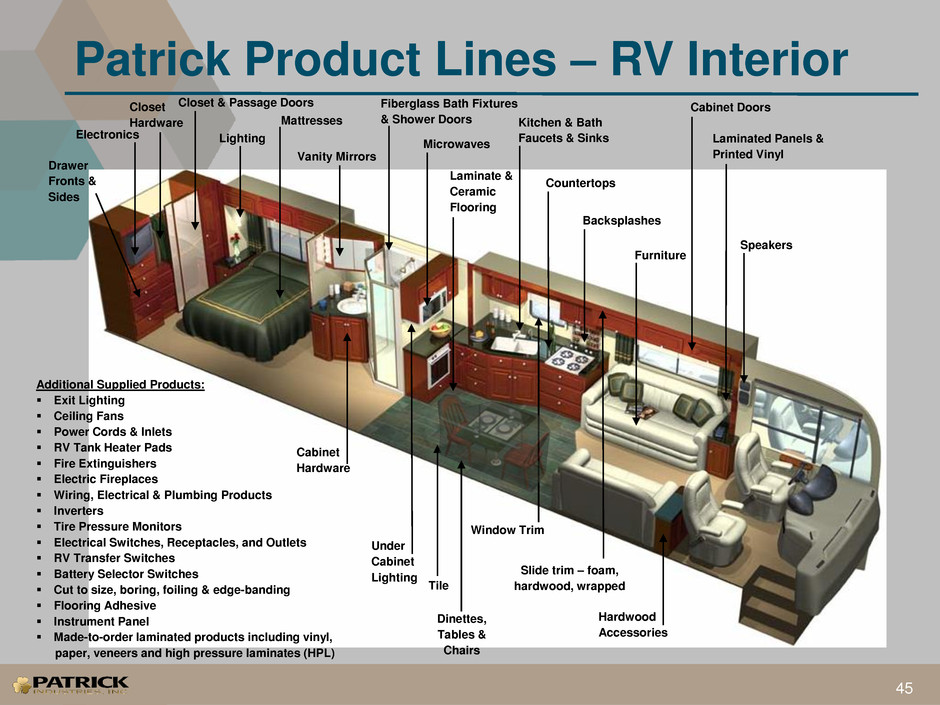
Patrick Product Lines – RV Interior
45
Additional Supplied Products:
Exit Lighting
Ceiling Fans
Power Cords & Inlets
RV Tank Heater Pads
Fire Extinguishers
Electric Fireplaces
Wiring, Electrical & Plumbing Products
Inverters
Tire Pressure Monitors
Electrical Switches, Receptacles, and Outlets
RV Transfer Switches
Battery Selector Switches
Cut to size, boring, foiling & edge-banding
Flooring Adhesive
Instrument Panel
Made-to-order laminated products including vinyl,
paper, veneers and high pressure laminates (HPL)
Electronics
Speakers
Microwaves
Furniture
Mattresses
Laminate &
Ceramic
Flooring
Closet
Hardware
Vanity Mirrors
Lighting
Closet & Passage Doors
Countertops
Drawer
Fronts &
Sides
Laminated Panels &
Printed Vinyl
Backsplashes
Hardwood
Accessories
Window Trim
Fiberglass Bath Fixtures
& Shower Doors Kitchen & Bath
Faucets & Sinks
Slide trim – foam,
hardwood, wrapped
Under
Cabinet
Lighting
Tile
Cabinet
Hardware
Dinettes,
Tables &
Chairs
Cabinet Doors
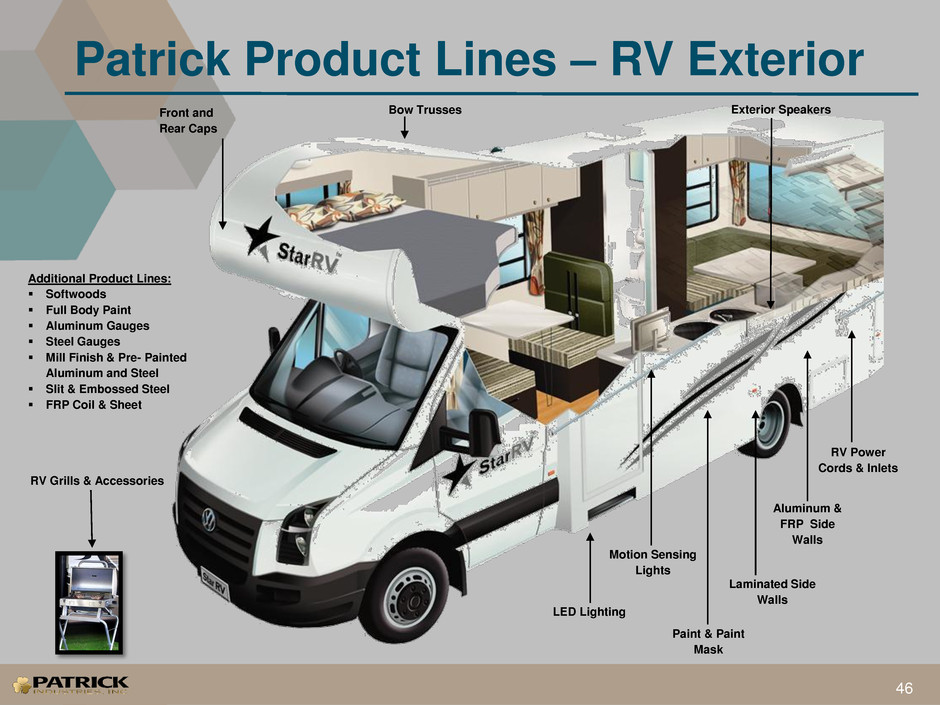
Patrick Product Lines – RV Exterior
46
Exterior Speakers
Paint & Paint
Mask
LED Lighting
Aluminum &
FRP Side
Walls
Laminated Side
Walls
Additional Product Lines:
Softwoods
Full Body Paint
Aluminum Gauges
Steel Gauges
Mill Finish & Pre- Painted
Aluminum and Steel
Slit & Embossed Steel
FRP Coil & Sheet
Motion Sensing
Lights
RV Power
Cords & Inlets
RV Grills & Accessories
Front and
Rear Caps
Bow Trusses
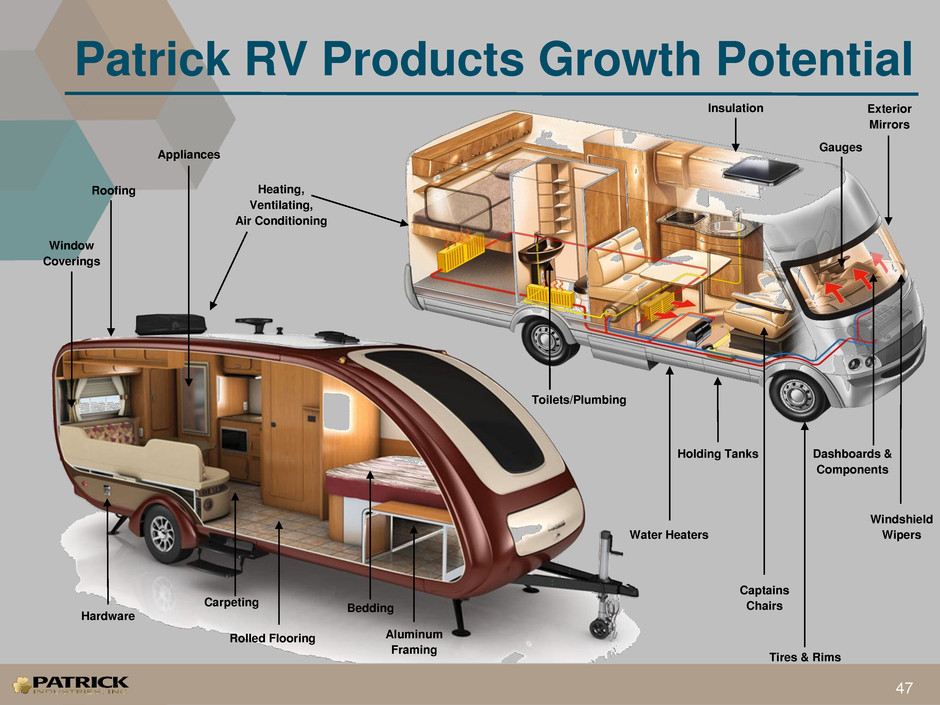
Patrick RV Products Growth Potential
47
Heating,
Ventilating,
Air Conditioning
Window
Coverings
Rolled Flooring
Bedding
Exterior
Mirrors
Carpeting
Windshield
Wipers
Holding Tanks
Captains
Chairs
Appliances
Toilets/Plumbing
Water Heaters
Gauges
Dashboards &
Components
Hardware
Tires & Rims
Roofing
Insulation
Aluminum
Framing
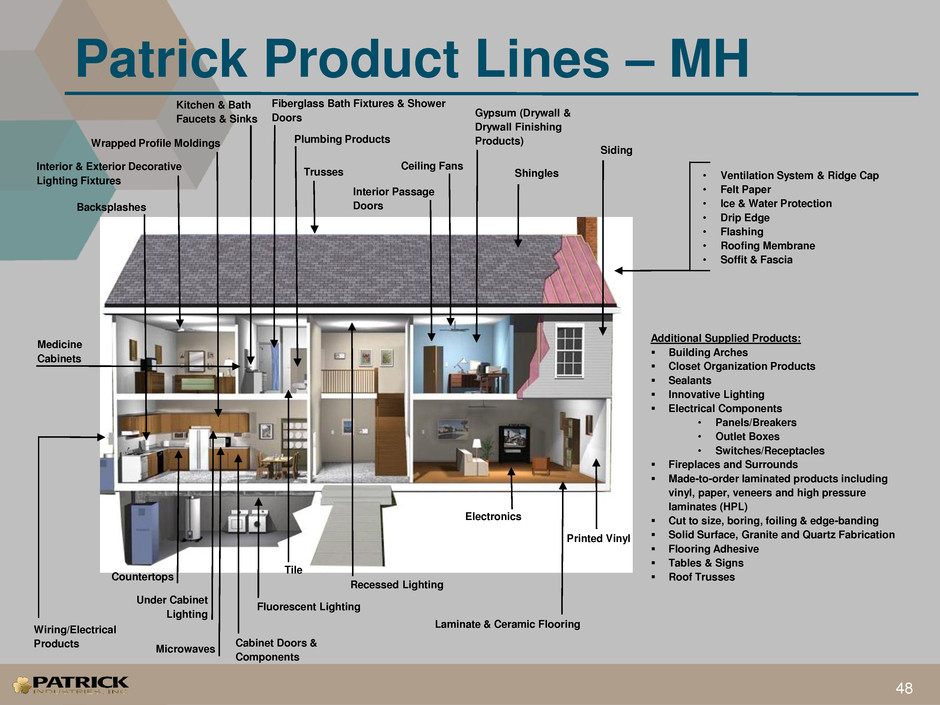
Patrick Product Lines – MH
48
Interior & Exterior Decorative
Lighting Fixtures
Interior Passage
Doors
Kitchen & Bath
Faucets & Sinks
Gypsum (Drywall &
Drywall Finishing
Products)
Laminate & Ceramic Flooring
Fiberglass Bath Fixtures & Shower
Doors
Cabinet Doors &
Components
Microwaves
Countertops
Electronics
Additional Supplied Products:
Building Arches
Closet Organization Products
Sealants
Innovative Lighting
Electrical Components
• Panels/Breakers
• Outlet Boxes
• Switches/Receptacles
Fireplaces and Surrounds
Made-to-order laminated products including
vinyl, paper, veneers and high pressure
laminates (HPL)
Cut to size, boring, foiling & edge-banding
Solid Surface, Granite and Quartz Fabrication
Flooring Adhesive
Tables & Signs
Roof Trusses
Siding
Shingles • Ventilation System & Ridge Cap
• Felt Paper
• Ice & Water Protection
• Drip Edge
• Flashing
• Roofing Membrane
• Soffit & Fascia
Wrapped Profile Moldings Plumbing Products
Backsplashes
Recessed Lighting
Fluorescent Lighting
Wiring/Electrical
Products
Ceiling Fans
Medicine
Cabinets
Under Cabinet
Lighting
Tile
Printed Vinyl
Trusses
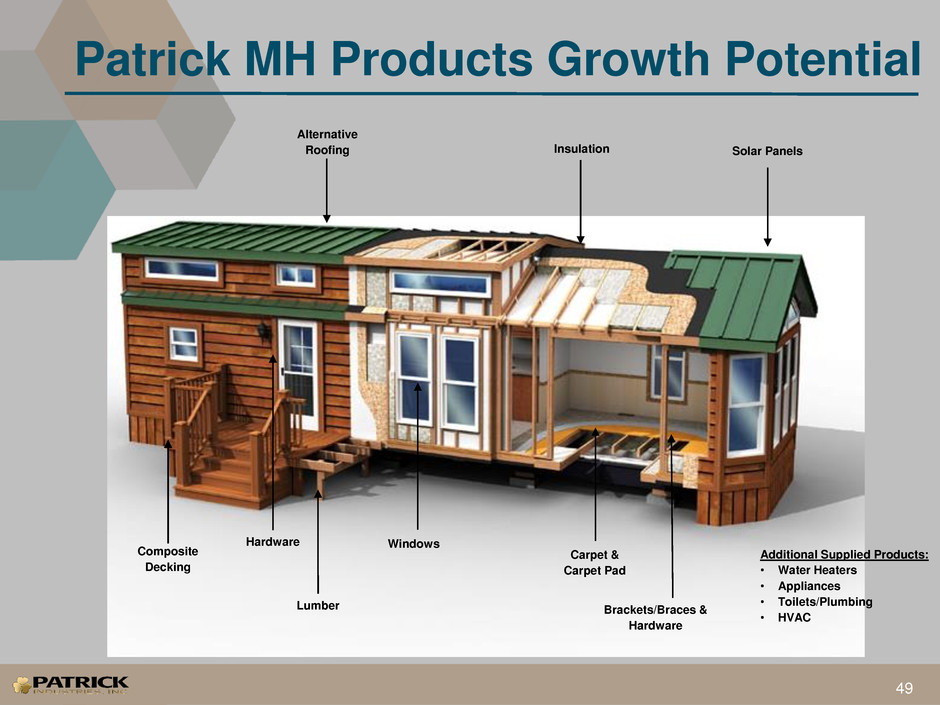
Patrick MH Products Growth Potential
49
Composite
Decking
Carpet &
Carpet Pad
Hardware
Alternative
Roofing Insulation
Lumber
Windows
Additional Supplied Products:
• Water Heaters
• Appliances
• Toilets/Plumbing
• HVAC
Solar Panels
Brackets/Braces &
Hardware
