EXHIBIT 99.1
Published on April 9, 2019

Patrick Industries, Inc. Investor Presentation April 2019
Forward-Looking Statements This presentation contains certain statements related to future results or states our intentions, beliefs and expectations or predictions for the future which are forward- looking statements as that term is defined in the Private Securities Litigation Reform Act of 1995. These forward-looking statements are subject to certain risks and uncertainties that could cause actual results to differ materially from either historical or anticipated results depending on a variety of factors. Further information concerning the Company and its business, including factors that potentially could materially affect the Company’s financial results, is contained in the Company’s filings with the Securities and Exchange Commission. This presentation includes market and industry data, forecasts and valuations that have been obtained from independent consultant reports, publicly available information, various industry publications and other published industry sources. Although we believe these sources are reliable, we have not independently verified the information and cannot make any representation as to the accuracy or completeness of such information. We disclaim any obligation or undertaking to disseminate any updates or revisions to any forward-looking statements contained in this presentation or to reflect any change in our expectations after the date of this presentation or any change in events, conditions or circumstances on which any statement is based. 2

Company Highlights & Overview
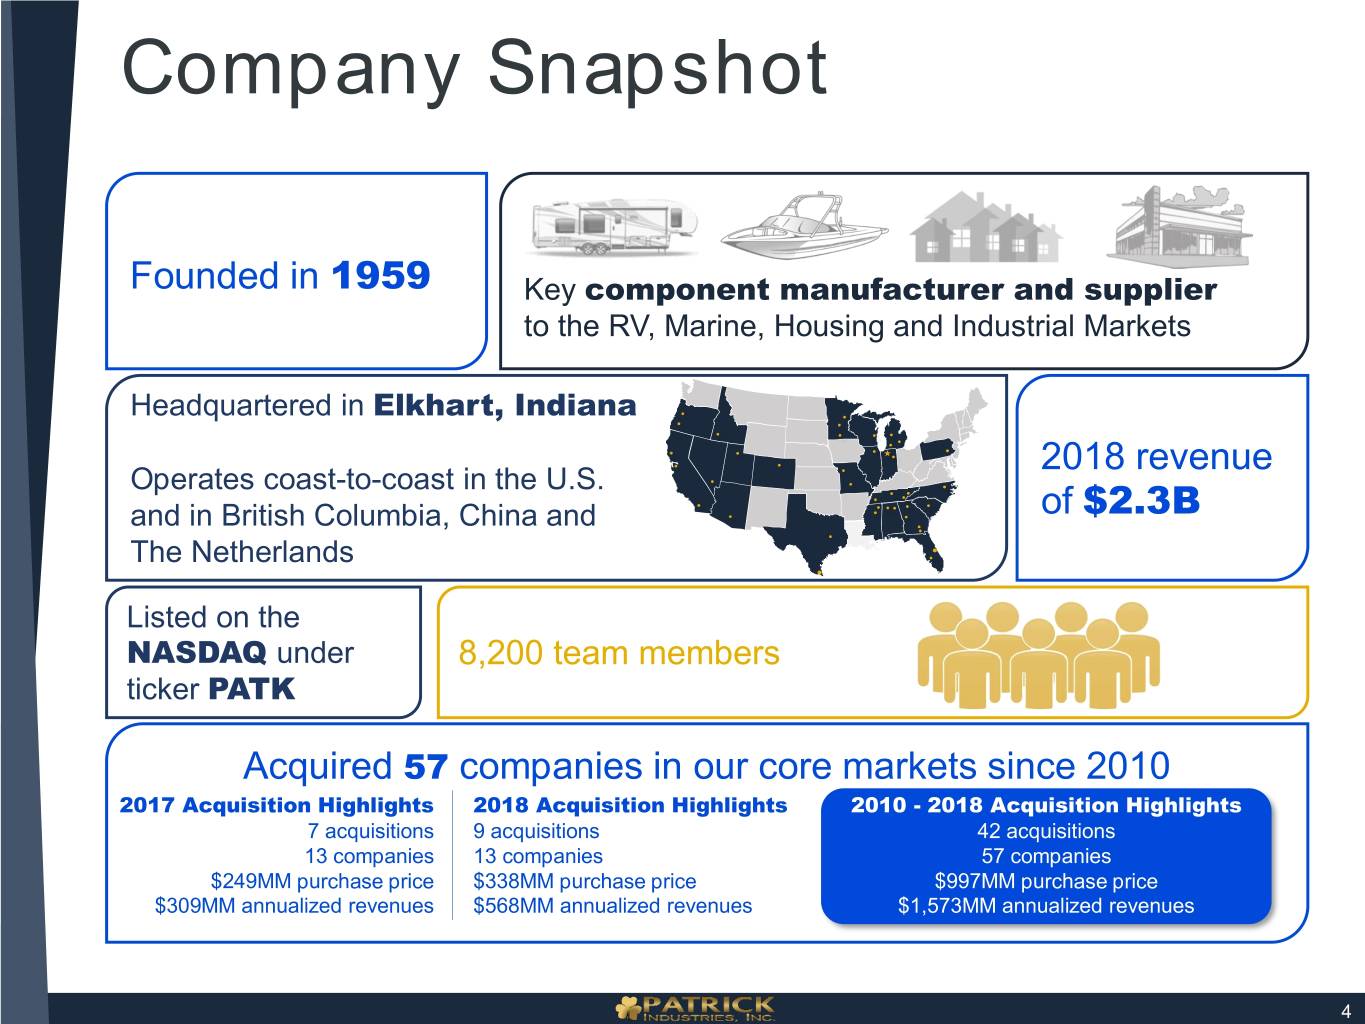
Company Snapshot Founded in 1959 Key component manufacturer and supplier to the RV, Marine, Housing and Industrial Markets Headquartered in Elkhart, Indiana 2018 revenue Operates coast-to-coast in the U.S. and in British Columbia, China and of $2.3B The Netherlands Listed on the NASDAQ under 8,200 team members ticker PATK Acquired 57 companies in our core markets since 2010 2017 Acquisition Highlights 2018 Acquisition Highlights 2010 - 2018 Acquisition Highlights 7 acquisitions 9 acquisitions 42 acquisitions 13 companies 13 companies 57 companies $249MM purchase price $338MM purchase price $997MM purchase price $309MM annualized revenues $568MM annualized revenues $1,573MM annualized revenues 4
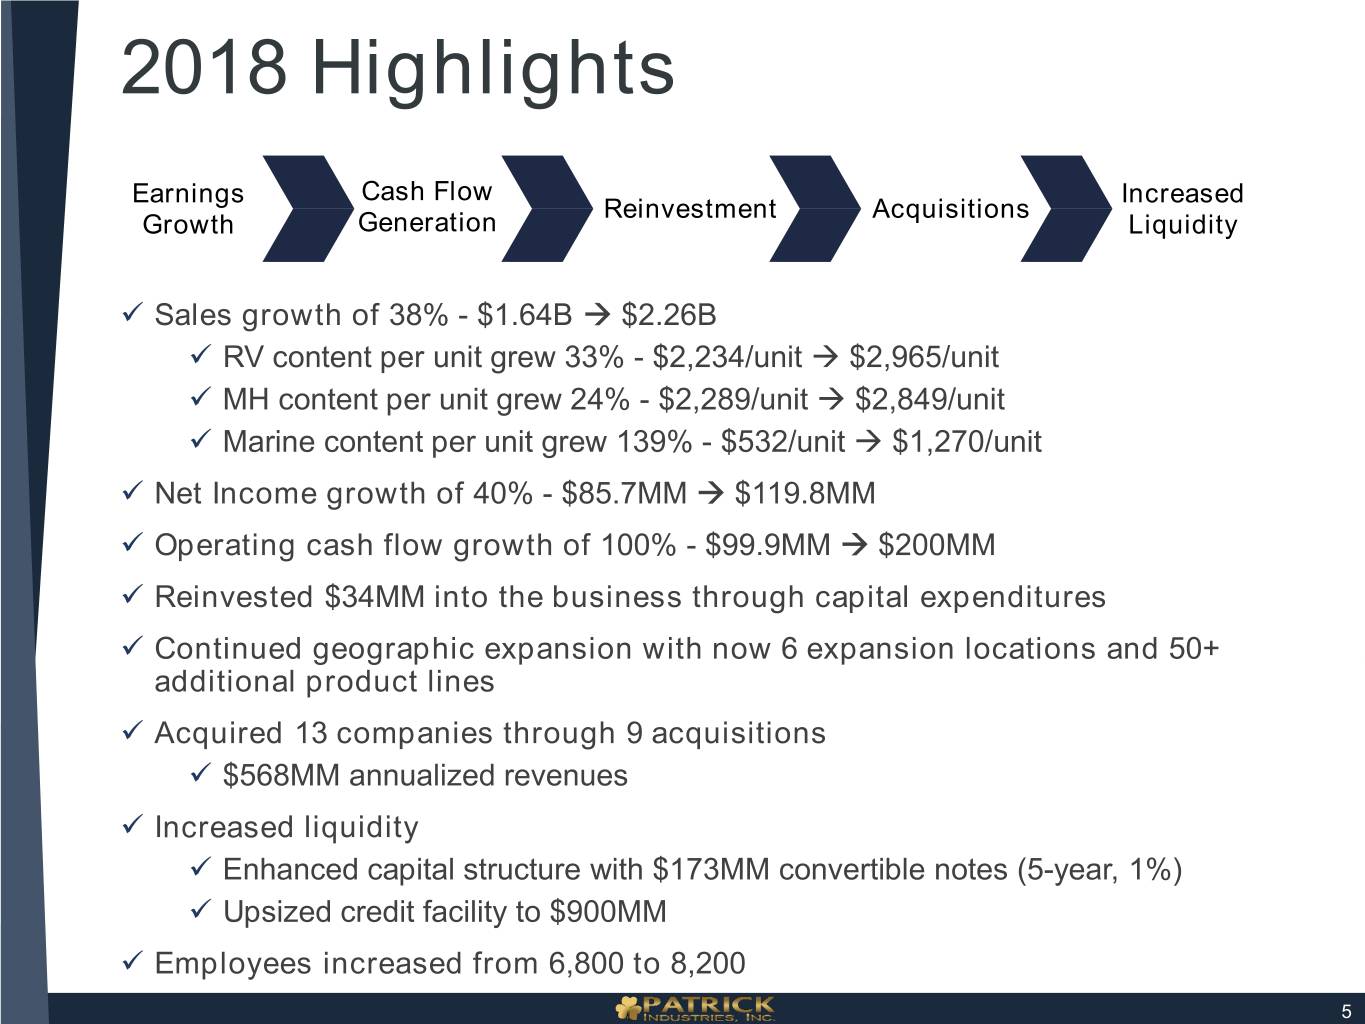
2018 Highlights Earnings Cash Flow Increased Reinvestment Acquisitions Growth Generation Liquidity Sales growth of 38% - $1.64B $2.26B RV content per unit grew 33% - $2,234/unit $2,965/unit MH content per unit grew 24% - $2,289/unit $2,849/unit Marine content per unit grew 139% - $532/unit $1,270/unit Net Income growth of 40% - $85.7MM $119.8MM Operating cash flow growth of 100% - $99.9MM $200MM Reinvested $34MM into the business through capital expenditures Continued geographic expansion with now 6 expansion locations and 50+ additional product lines Acquired 13 companies through 9 acquisitions $568MM annualized revenues Increased liquidity Enhanced capital structure with $173MM convertible notes (5-year, 1%) Upsized credit facility to $900MM Employees increased from 6,800 to 8,200 5
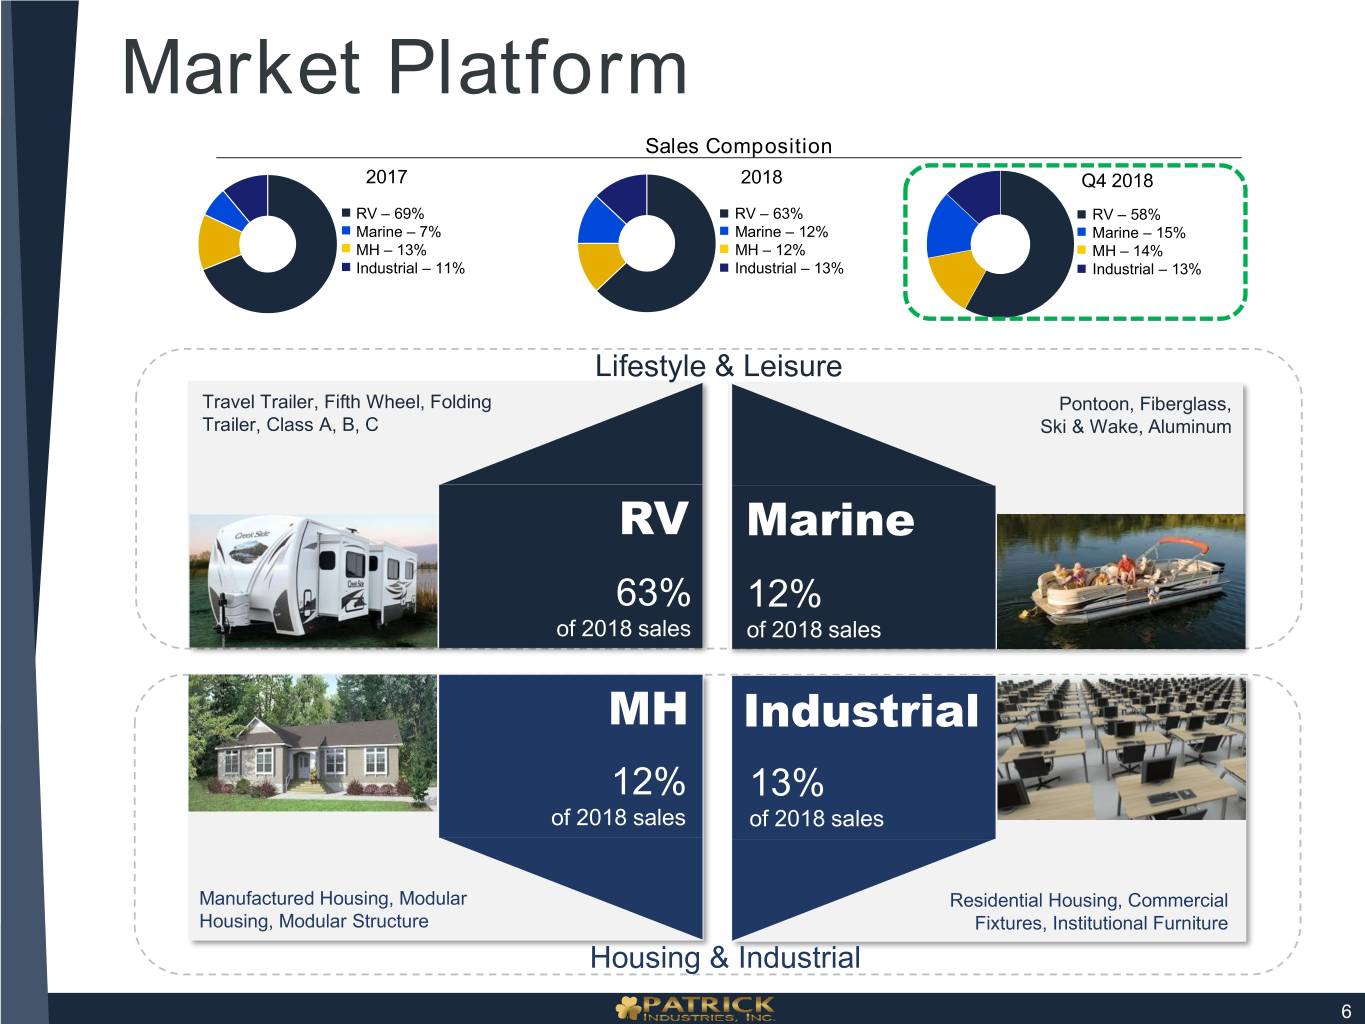
Market Platform Sales Composition 2017 2018 Q4 2018 RV – 69% RV – 63% RV – 58% Marine – 7% Marine – 12% Marine – 15% MH – 13% MH – 12% MH – 14% Industrial – 11% Industrial – 13% Industrial – 13% Lifestyle & Leisure Travel Trailer, Fifth Wheel, Folding Pontoon, Fiberglass, Trailer, Class A, B, C Ski & Wake, Aluminum RV Marine 63% 12% of 2018 sales of 2018 sales MH Industrial 12% 13% of 2018 sales of 2018 sales Manufactured Housing, Modular Residential Housing, Commercial Housing, Modular Structure Fixtures, Institutional Furniture Housing & Industrial 6
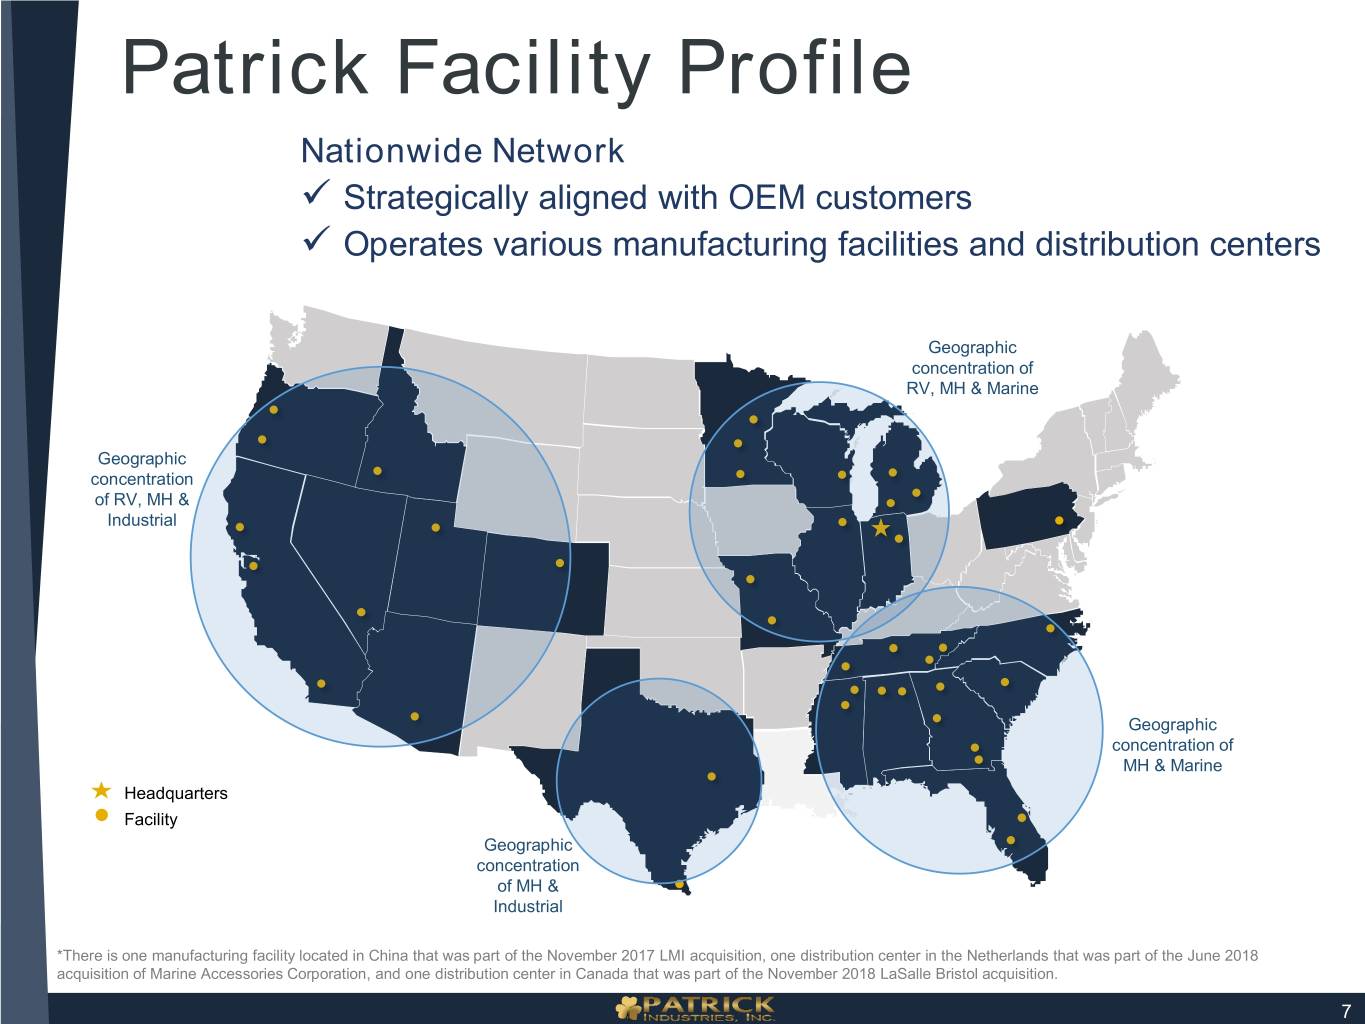
Patrick Facility Profile Nationwide Network Strategically aligned with OEM customers Operates various manufacturing facilities and distribution centers Geographic concentration of RV, MH & Marine Geographic concentration of RV, MH & Industrial Geographic concentration of MH & Marine Headquarters Facility Geographic concentration of MH & Industrial *There is one manufacturing facility located in China that was part of the November 2017 LMI acquisition, one distribution center in the Netherlands that was part of the June 2018 acquisition of Marine Accessories Corporation, and one distribution center in Canada that was part of the November 2018 LaSalle Bristol acquisition. 7

Markets Served & Trends
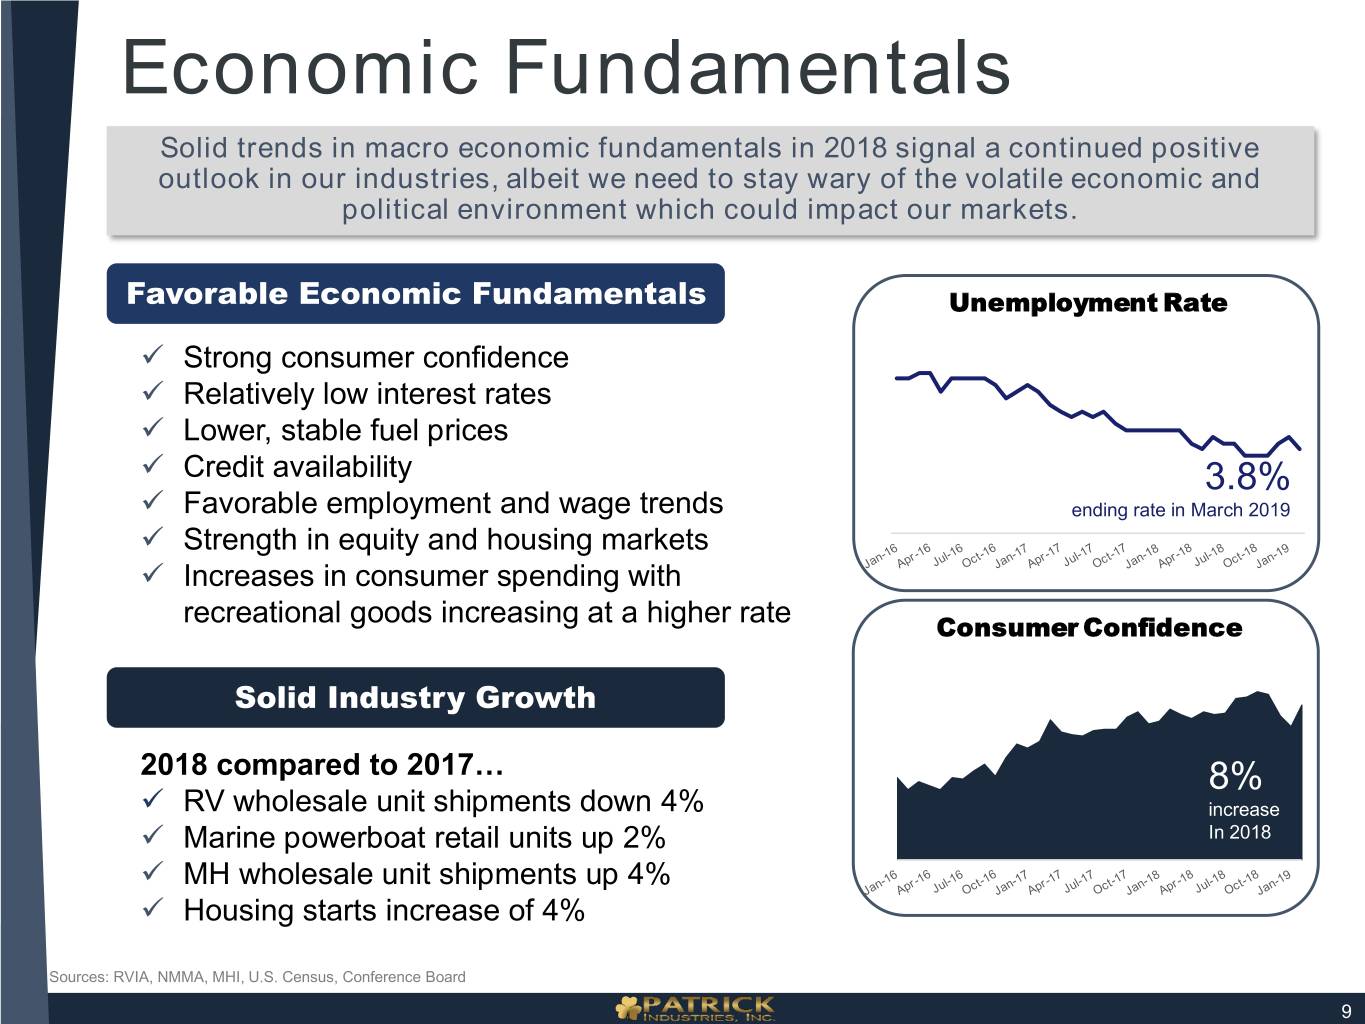
Economic Fundamentals Solid trends in macro economic fundamentals in 2018 signal a continued positive outlook in our industries, albeit we need to stay wary of the volatile economic and political environment which could impact our markets. Favorable Economic Fundamentals Unemployment Rate Strong consumer confidence Relatively low interest rates Lower, stable fuel prices Credit availability 3.8% Favorable employment and wage trends ending rate in March 2019 Strength in equity and housing markets Increases in consumer spending with recreational goods increasing at a higher rate Consumer Confidence Solid Industry Growth 2018 compared to 2017… 8% RV wholesale unit shipments down 4% increase Marine powerboat retail units up 2% In 2018 MH wholesale unit shipments up 4% Housing starts increase of 4% Sources: RVIA, NMMA, MHI, U.S. Census, Conference Board 9
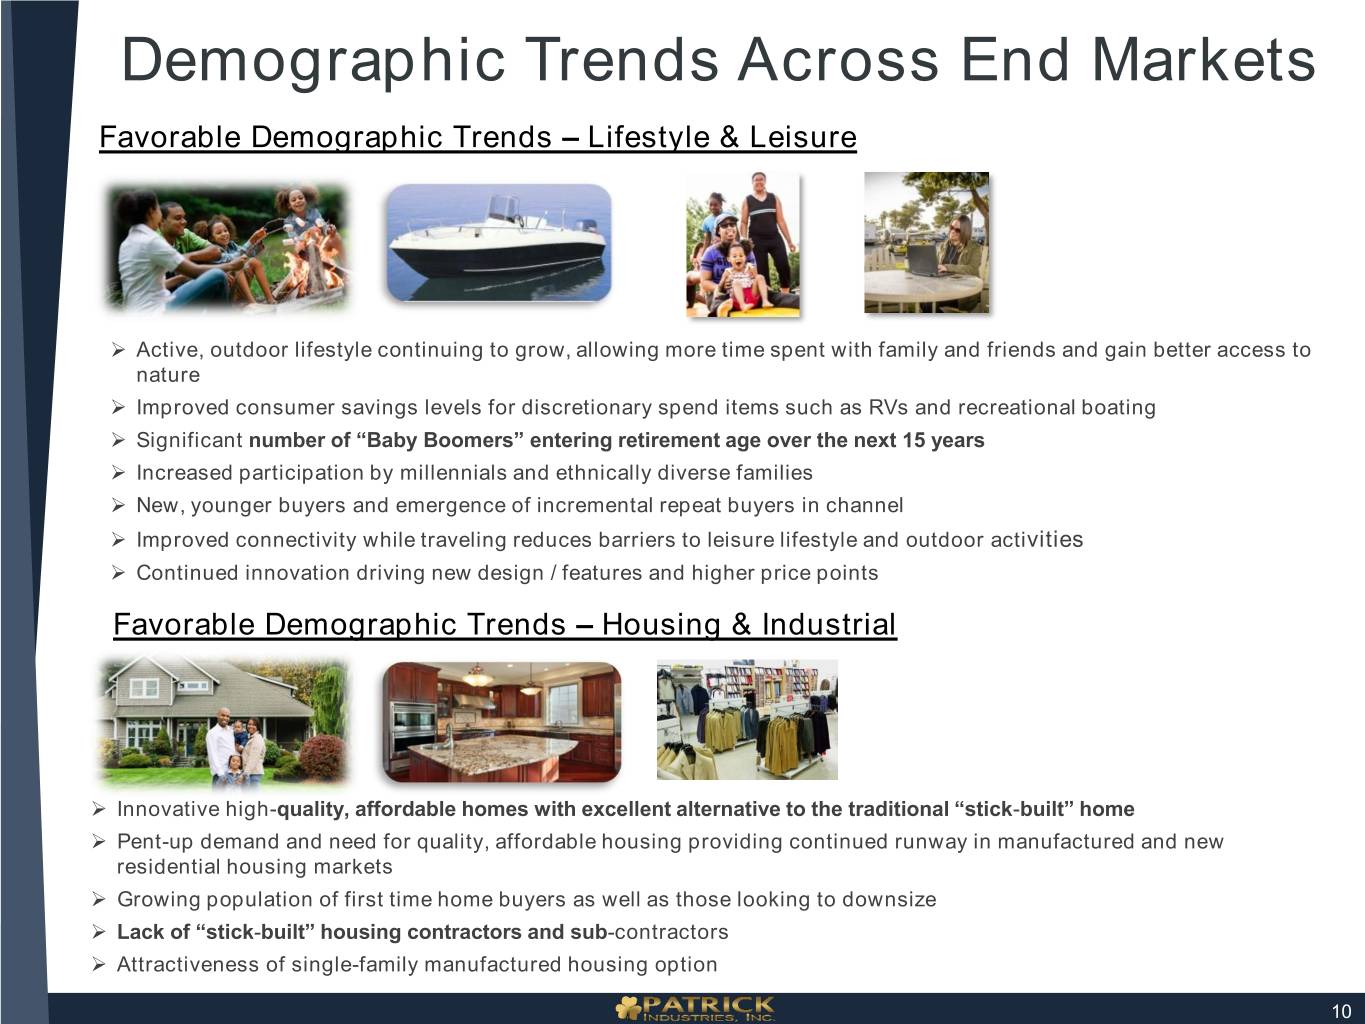
Demographic Trends Across End Markets Favorable Demographic Trends – Lifestyle & Leisure Active, outdoor lifestyle continuing to grow, allowing more time spent with family and friends and gain better access to nature Improved consumer savings levels for discretionary spend items such as RVs and recreational boating Significant number of “Baby Boomers” entering retirement age over the next 15 years Increased participation by millennials and ethnically diverse families New, younger buyers and emergence of incremental repeat buyers in channel Improved connectivity while traveling reduces barriers to leisure lifestyle and outdoor activities Continued innovation driving new design / features and higher price points Favorable Demographic Trends – Housing & Industrial Innovative high-quality, affordable homes with excellent alternative to the traditional “stick-built” home Pent-up demand and need for quality, affordable housing providing continued runway in manufactured and new residential housing markets Growing population of first time home buyers as well as those looking to downsize Lack of “stick-built” housing contractors and sub-contractors Attractiveness of single-family manufactured housing option 10
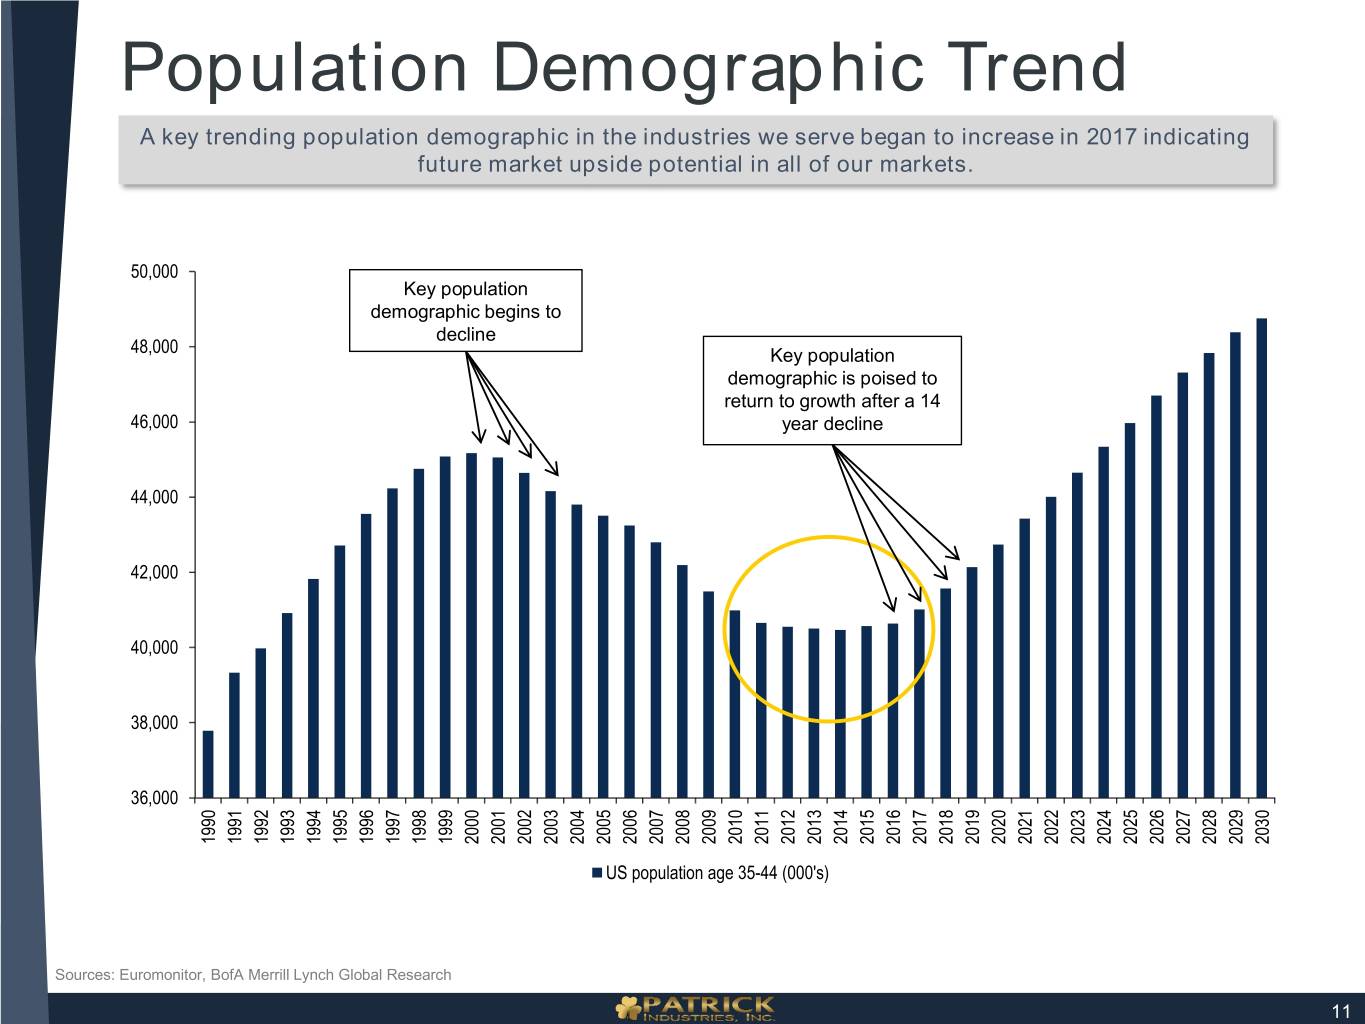
Population Demographic Trend A key trending population demographic in the industries we serve began to increase in 2017 indicating future market upside potential in all of our markets. 50,000 Key population demographic begins to decline 48,000 Key population demographic is poised to return to growth after a 14 46,000 year decline 44,000 42,000 40,000 38,000 36,000 2000 2001 2027 2028 1990 1991 1992 1993 1994 1995 1996 1997 1998 1999 2002 2003 2004 2005 2006 2007 2008 2009 2010 2011 2012 2013 2014 2015 2016 2017 2018 2019 2020 2021 2022 2023 2024 2025 2026 2029 2030 US population age 35-44 (000's) Sources: Euromonitor, BofA Merrill Lynch Global Research 11
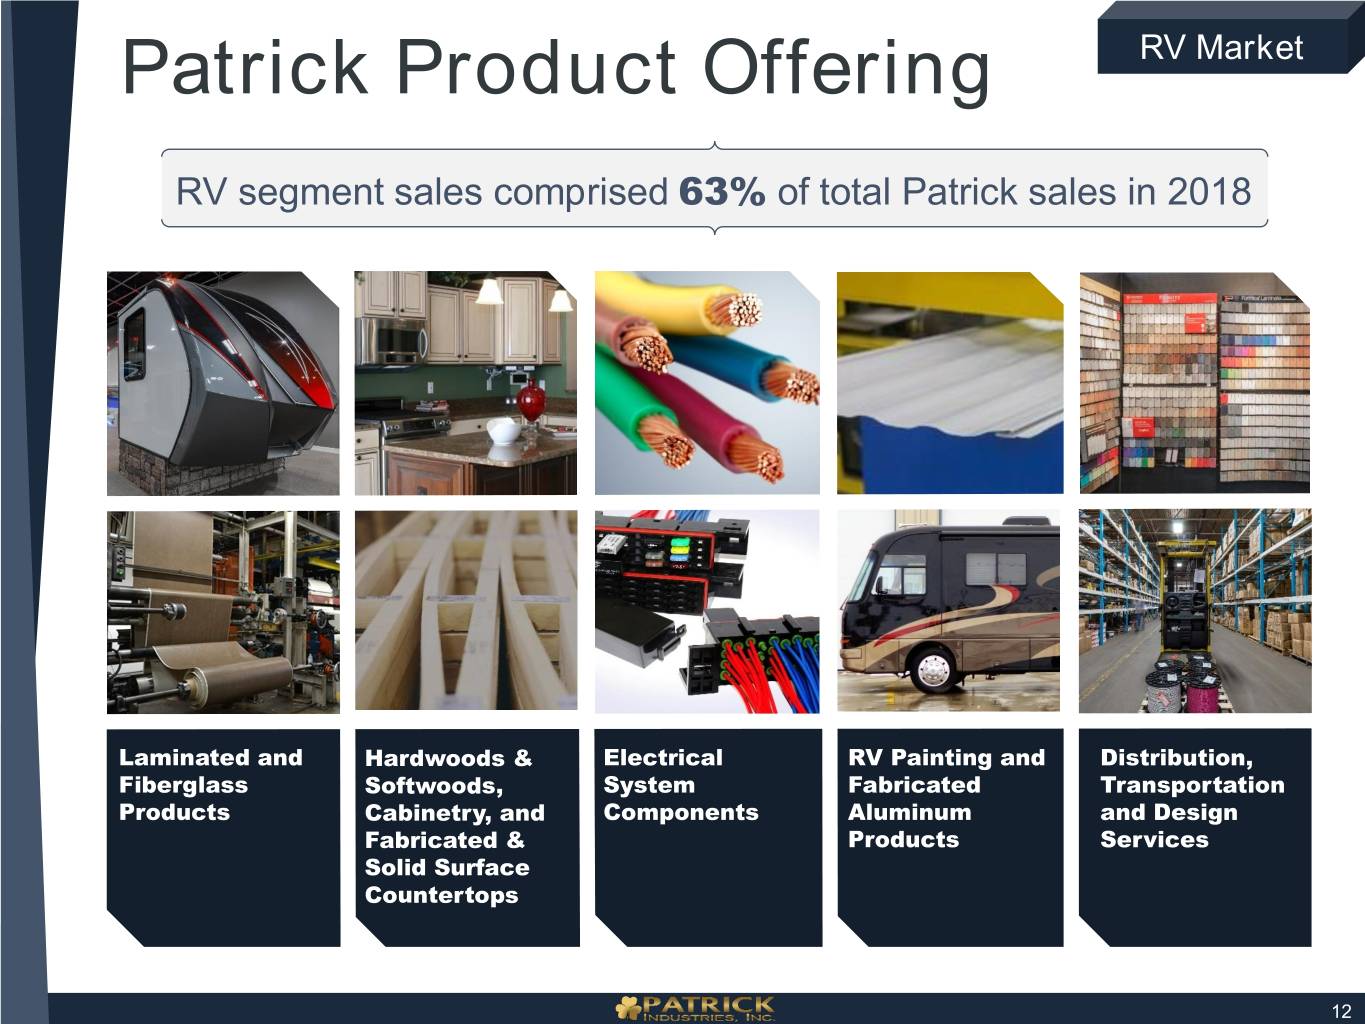
Patrick Product Offering RV Market RV segment sales comprised 63% of total Patrick sales in 2018 Laminated and Hardwoods & Electrical RV Painting and Distribution, Fiberglass Softwoods, System Fabricated Transportation Products Cabinetry, and Components Aluminum and Design Fabricated & Products Services Solid Surface Countertops 12
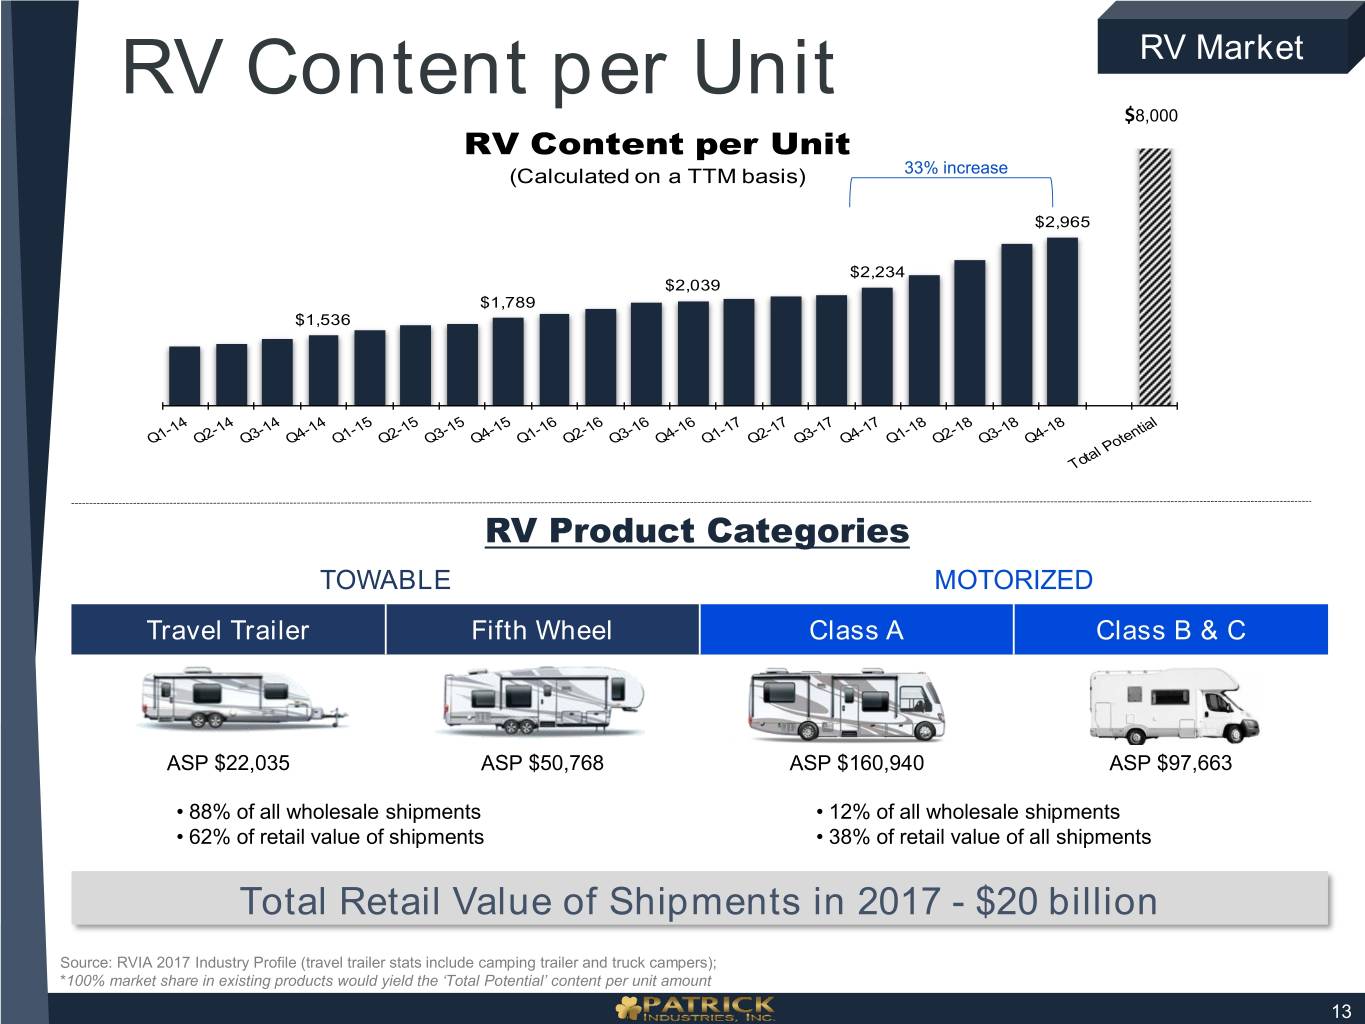
RV Content per Unit RV Market $8,000 RV Content per Unit (Calculated on a TTM basis) 33% increase $2,965 $2,234 $2,039 $1,789 $1,536 RV Product Categories TOWABLE MOTORIZED Travel Trailer Fifth Wheel Class A Class B & C ASP $22,035 ASP $50,768 ASP $160,940 ASP $97,663 • 88% of all wholesale shipments • 12% of all wholesale shipments • 62% of retail value of shipments • 38% of retail value of all shipments Total Retail Value of Shipments in 2017 - $20 billion Source: RVIA 2017 Industry Profile (travel trailer stats include camping trailer and truck campers); *100% market share in existing products would yield the ‘Total Potential’ content per unit amount 13
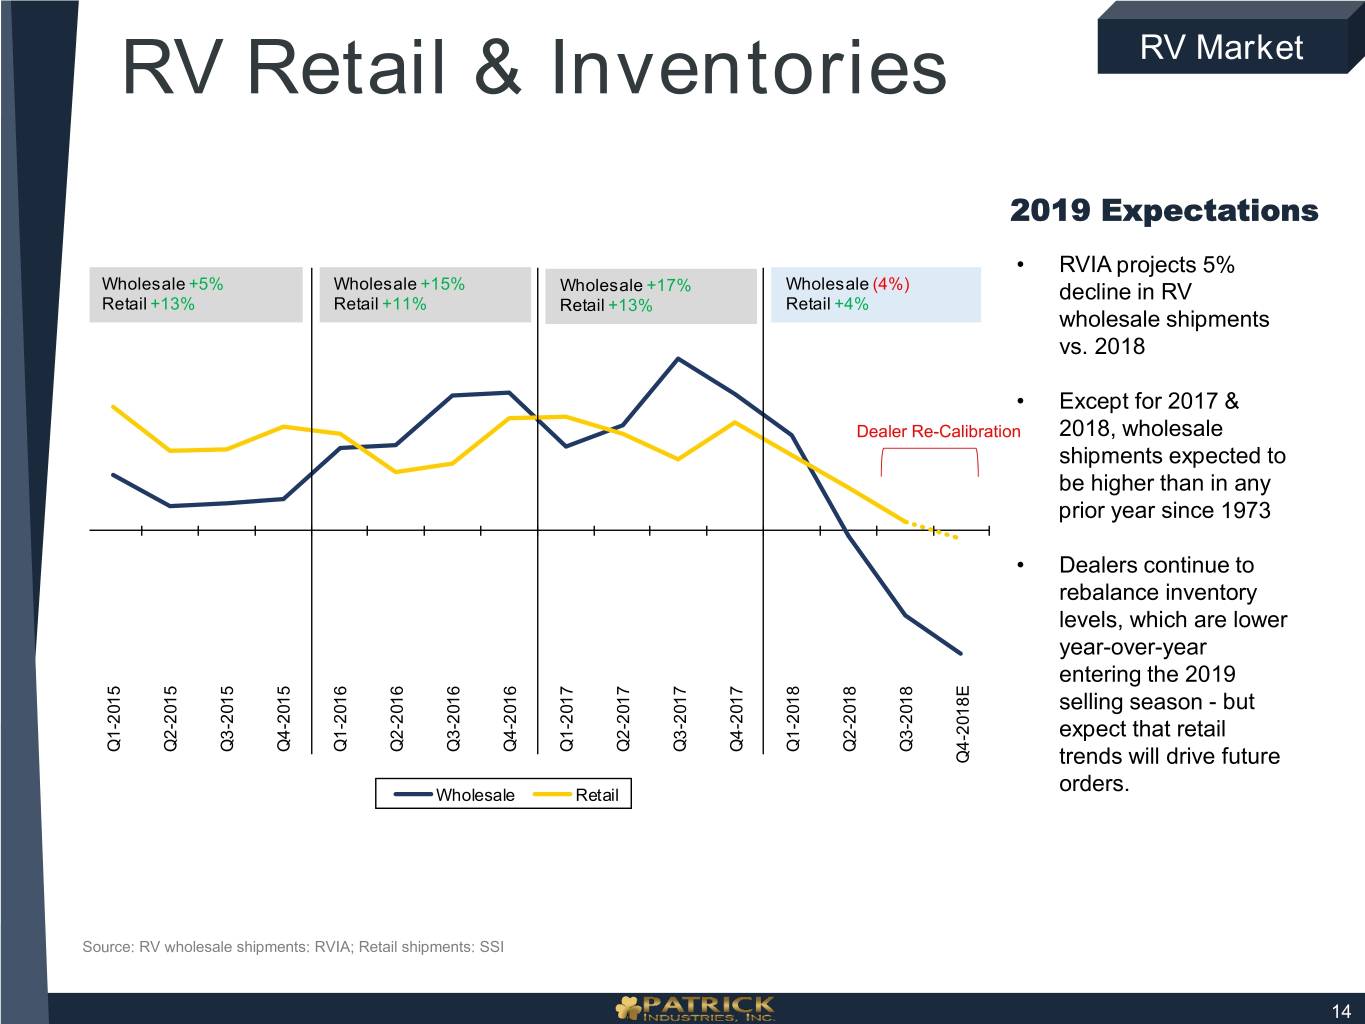
RV Retail & Inventories RV Market 2019 Expectations • RVIA projects 5% Wholesale +5% Wholesale +15% Wholesale +17% Wholesale (4%) decline in RV Retail +13% Retail +11% Retail +13% Retail +4% wholesale shipments vs. 2018 • Except for 2017 & Dealer Re-Calibration 2018, wholesale shipments expected to be higher than in any prior year since 1973 • Dealers continue to rebalance inventory levels, which are lower year-over-year entering the 2019 selling season - but expect that retail Q1-2015 Q2-2015 Q2-2016 Q3-2016 Q4-2016 Q1-2017 Q2-2017 Q2-2018 Q3-2018 Q3-2015 Q4-2015 Q1-2016 Q3-2017 Q4-2017 Q1-2018 Q4-2018E trends will drive future orders. Wholesale Retail Source: RV wholesale shipments: RVIA; Retail shipments: SSI 14
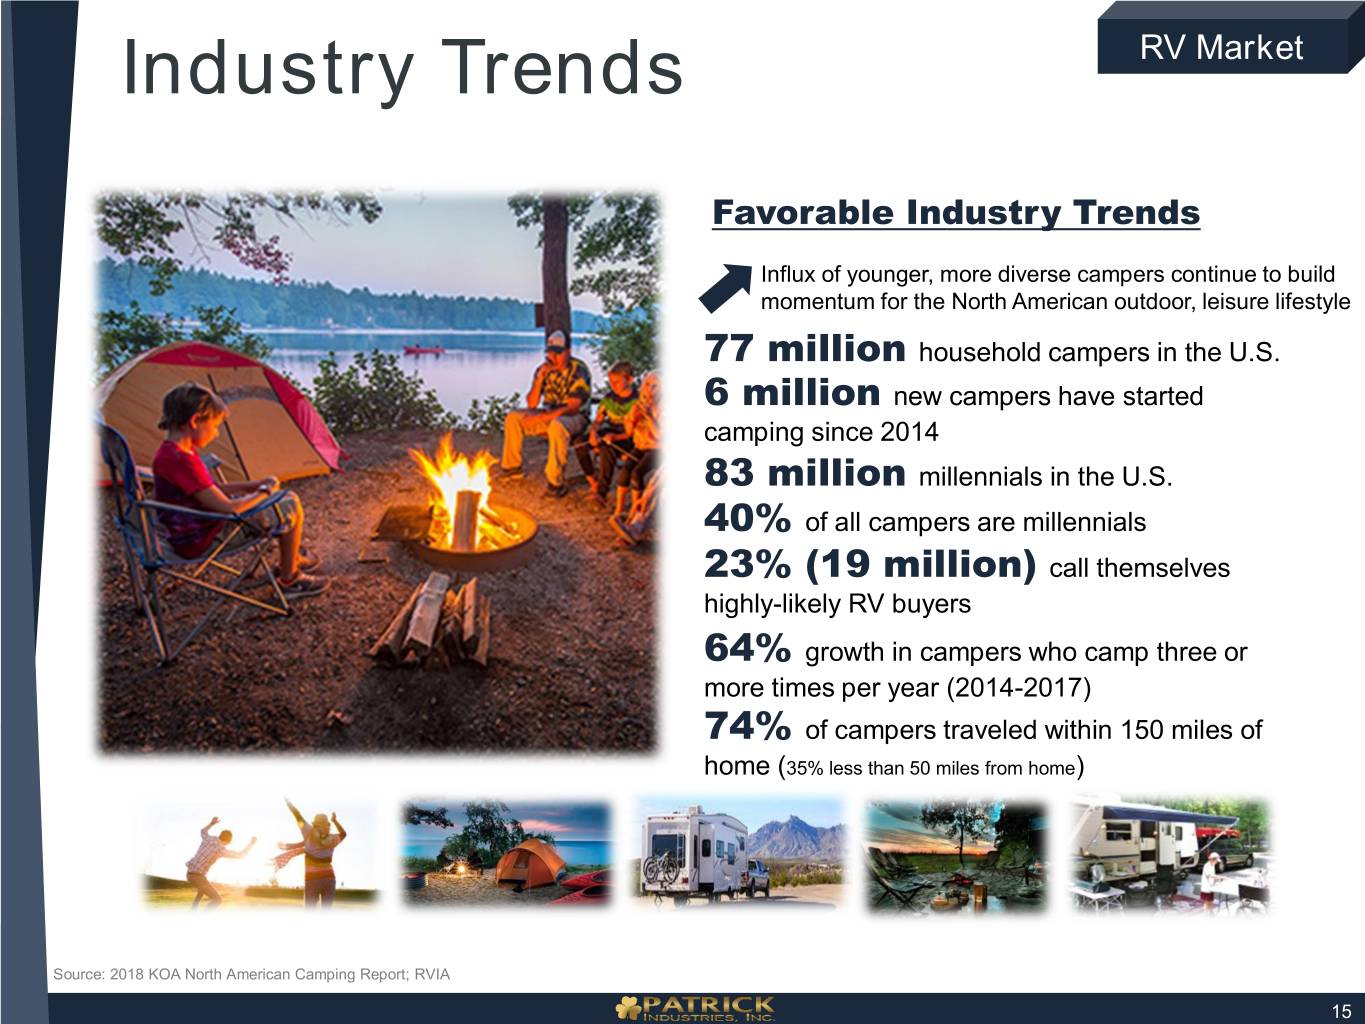
Industry Trends RV Market Favorable Industry Trends Influx of younger, more diverse campers continue to build momentum for the North American outdoor, leisure lifestyle 77 million household campers in the U.S. 6 million new campers have started camping since 2014 83 million millennials in the U.S. 40% of all campers are millennials 23% (19 million) call themselves highly-likely RV buyers 64% growth in campers who camp three or more times per year (2014-2017) 74% of campers traveled within 150 miles of home (35% less than 50 miles from home) Source: 2018 KOA North American Camping Report; RVIA 15
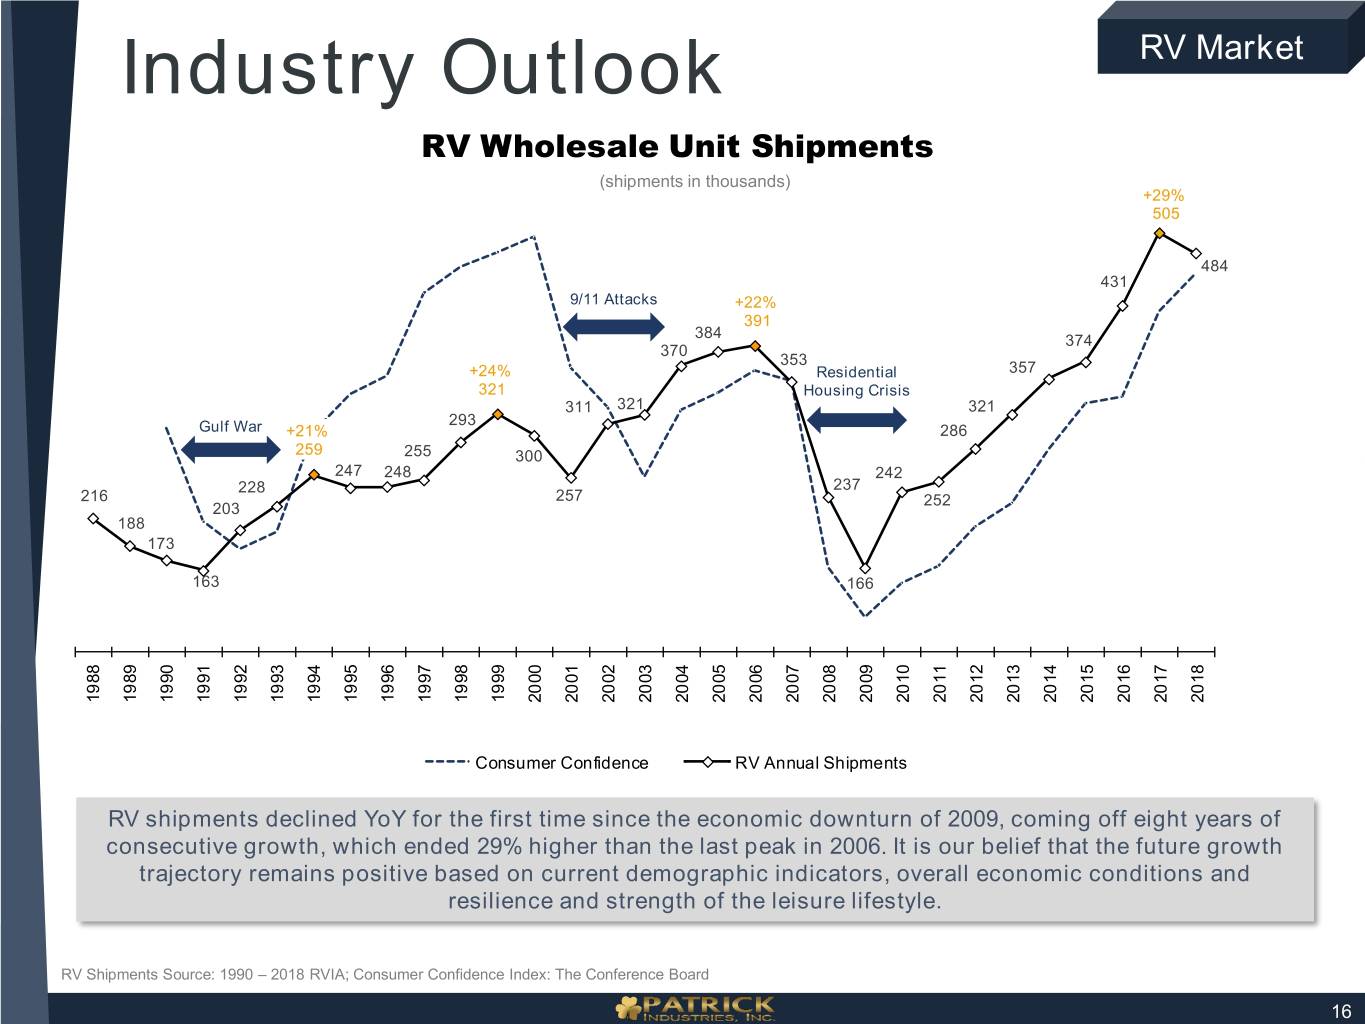
Industry Outlook RV Market RV Wholesale Unit Shipments (shipments in thousands) +29% 505 484 431 9/11 Attacks +22% 391 384 374 370 353 +24% Residential 357 321 Housing Crisis 311 321 321 293 Gulf War +21% 286 259 255 300 247 248 242 228 237 216 257 252 203 188 173 163 166 1995 1996 1997 1998 1999 2000 2009 2010 2011 2012 2013 2014 1988 1989 1990 1991 1992 1993 1994 2001 2002 2003 2004 2005 2006 2007 2008 2015 2016 2017 2018 Consumer Confidence RV Annual Shipments RV shipments declined YoY for the first time since the economic downturn of 2009, coming off eight years of consecutive growth, which ended 29% higher than the last peak in 2006. It is our belief that the future growth trajectory remains positive based on current demographic indicators, overall economic conditions and resilience and strength of the leisure lifestyle. RV Shipments Source: 1990 – 2018 RVIA; Consumer Confidence Index: The Conference Board 16
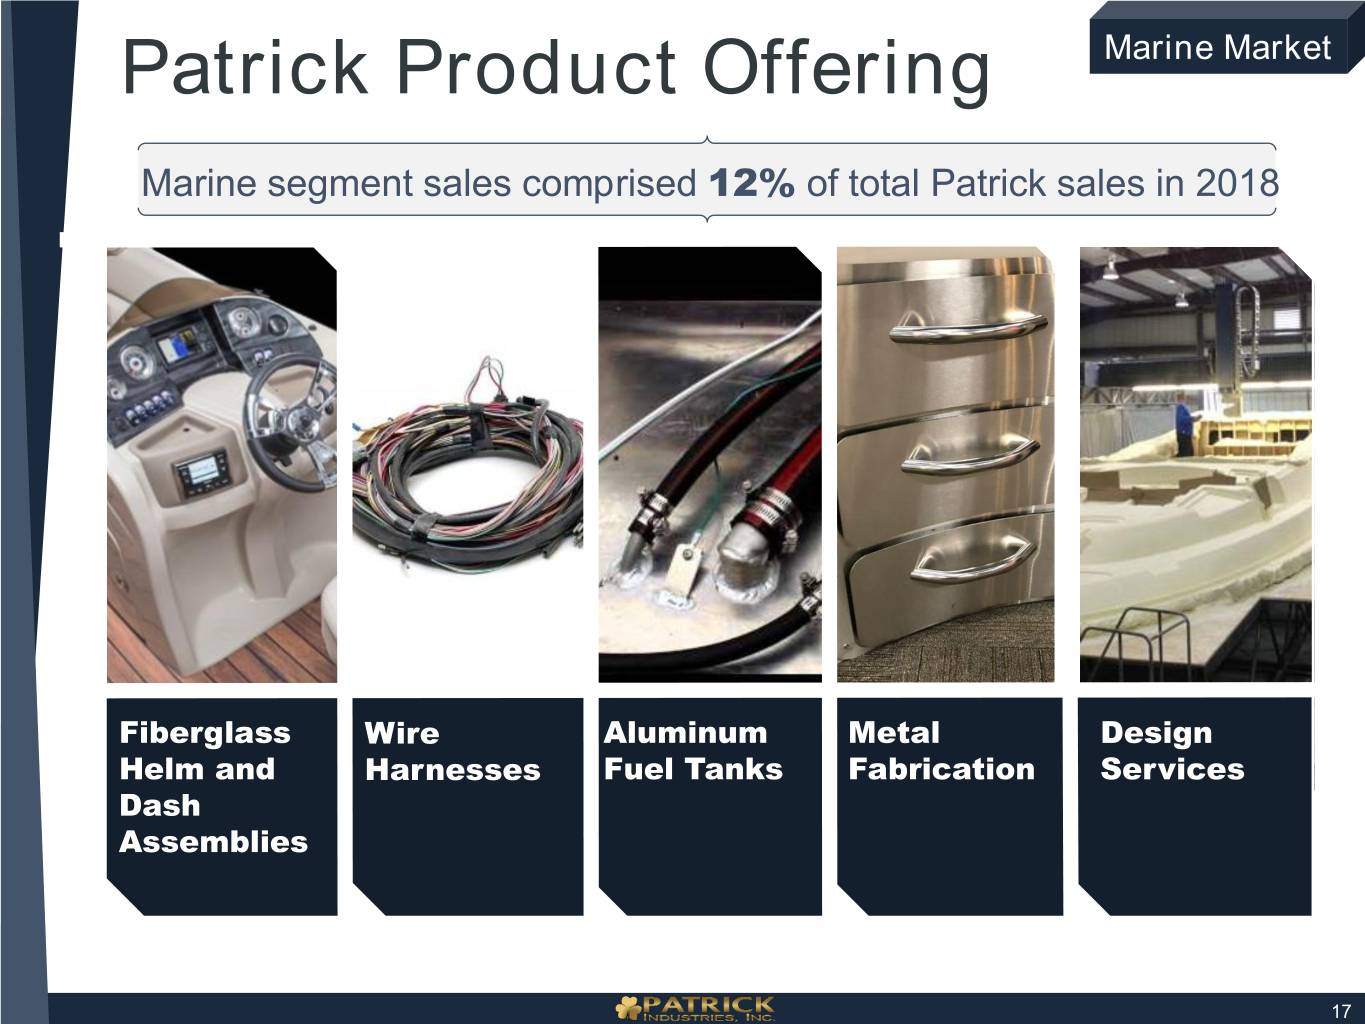
Patrick Product Offering Marine Market Marine segment sales comprised 12% of total Patrick sales in 2018 Fiberglass Wire Aluminum Metal Design Helm and Harnesses Fuel Tanks Fabrication Services Dash Assemblies 17
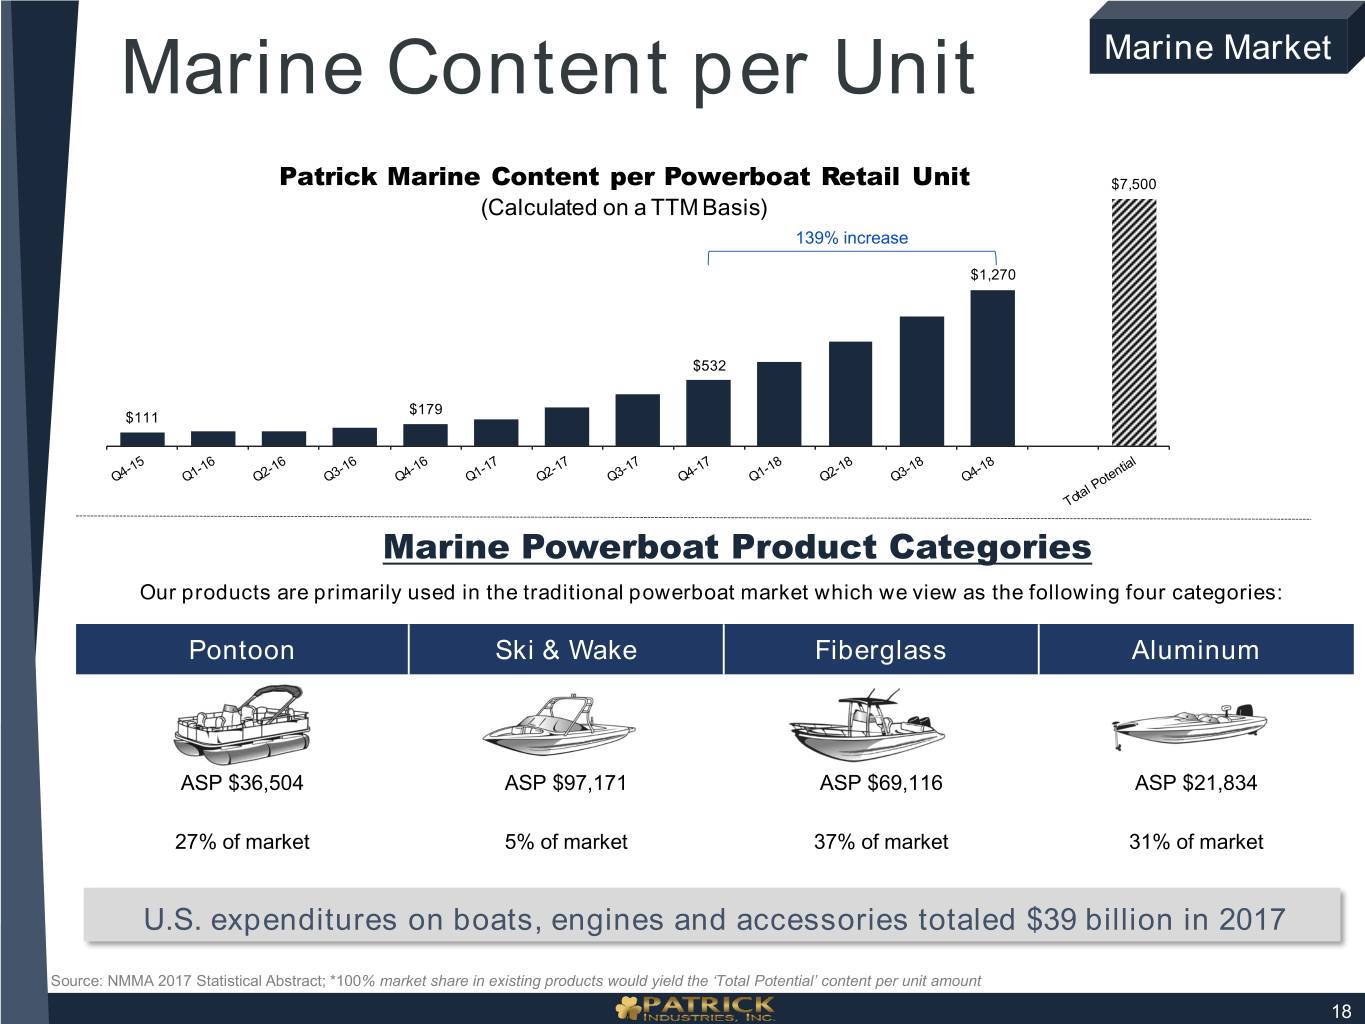
Marine Content per Unit Marine Market Patrick Marine Content per Powerboat Retail Unit $7,500 (Calculated on a TTM Basis) 139% increase $1,270 $532 $179 $111 Marine Powerboat Product Categories Our products are primarily used in the traditional powerboat market which we view as the following four categories: Pontoon Ski & Wake Fiberglass Aluminum ASP $36,504 ASP $97,171 ASP $69,116 ASP $21,834 27% of market 5% of market 37% of market 31% of market U.S. expenditures on boats, engines and accessories totaled $39 billion in 2017 Source: NMMA 2017 Statistical Abstract; *100% market share in existing products would yield the ‘Total Potential’ content per unit amount 18
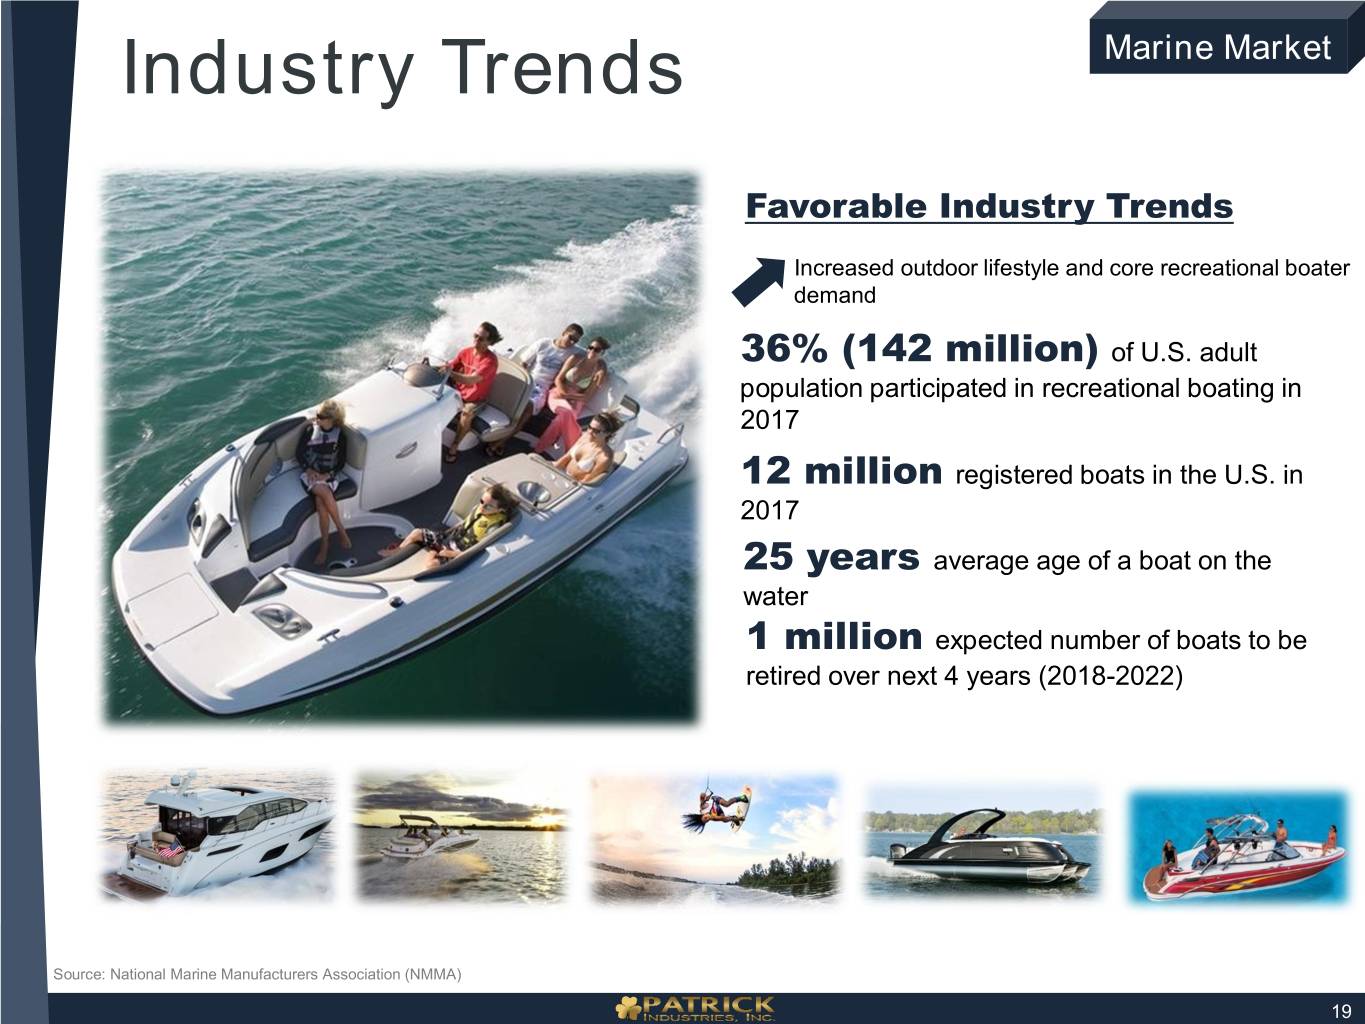
Industry Trends Marine Market Favorable Industry Trends Increased outdoor lifestyle and core recreational boater demand 36% (142 million) of U.S. adult population participated in recreational boating in 2017 12 million registered boats in the U.S. in 2017 25 years average age of a boat on the water 1 million expected number of boats to be retired over next 4 years (2018-2022) Source: National Marine Manufacturers Association (NMMA) 19
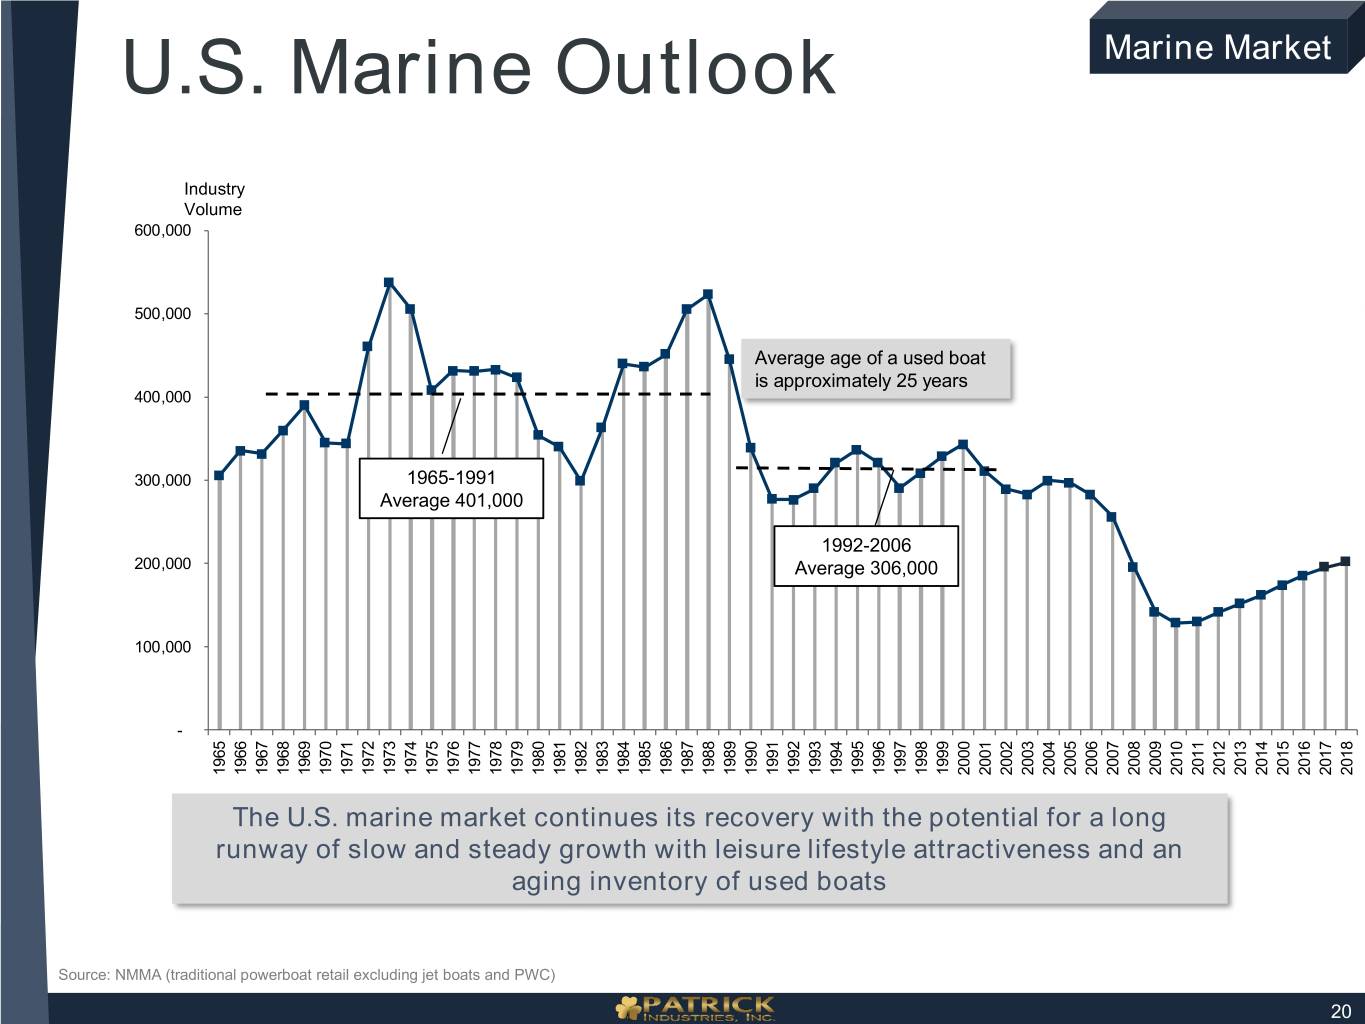
U.S. Marine Outlook Marine Market Industry Volume 600,000 500,000 Average age of a used boat is approximately 25 years 400,000 300,000 1965-1991 Average 401,000 1992-2006 200,000 Average 306,000 100,000 - 1970 1971 1972 1973 1979 1980 1981 1987 1988 1989 1990 1996 1997 1998 2004 2005 2006 2007 2013 2014 2015 1965 1966 1967 1968 1969 1974 1975 1976 1977 1978 1982 1983 1984 1985 1986 1991 1992 1993 1994 1995 1999 2000 2001 2002 2003 2008 2009 2010 2011 2012 2016 2017 2018 The U.S. marine market continues its recovery with the potential for a long runway of slow and steady growth with leisure lifestyle attractiveness and an aging inventory of used boats Source: NMMA (traditional powerboat retail excluding jet boats and PWC) 20
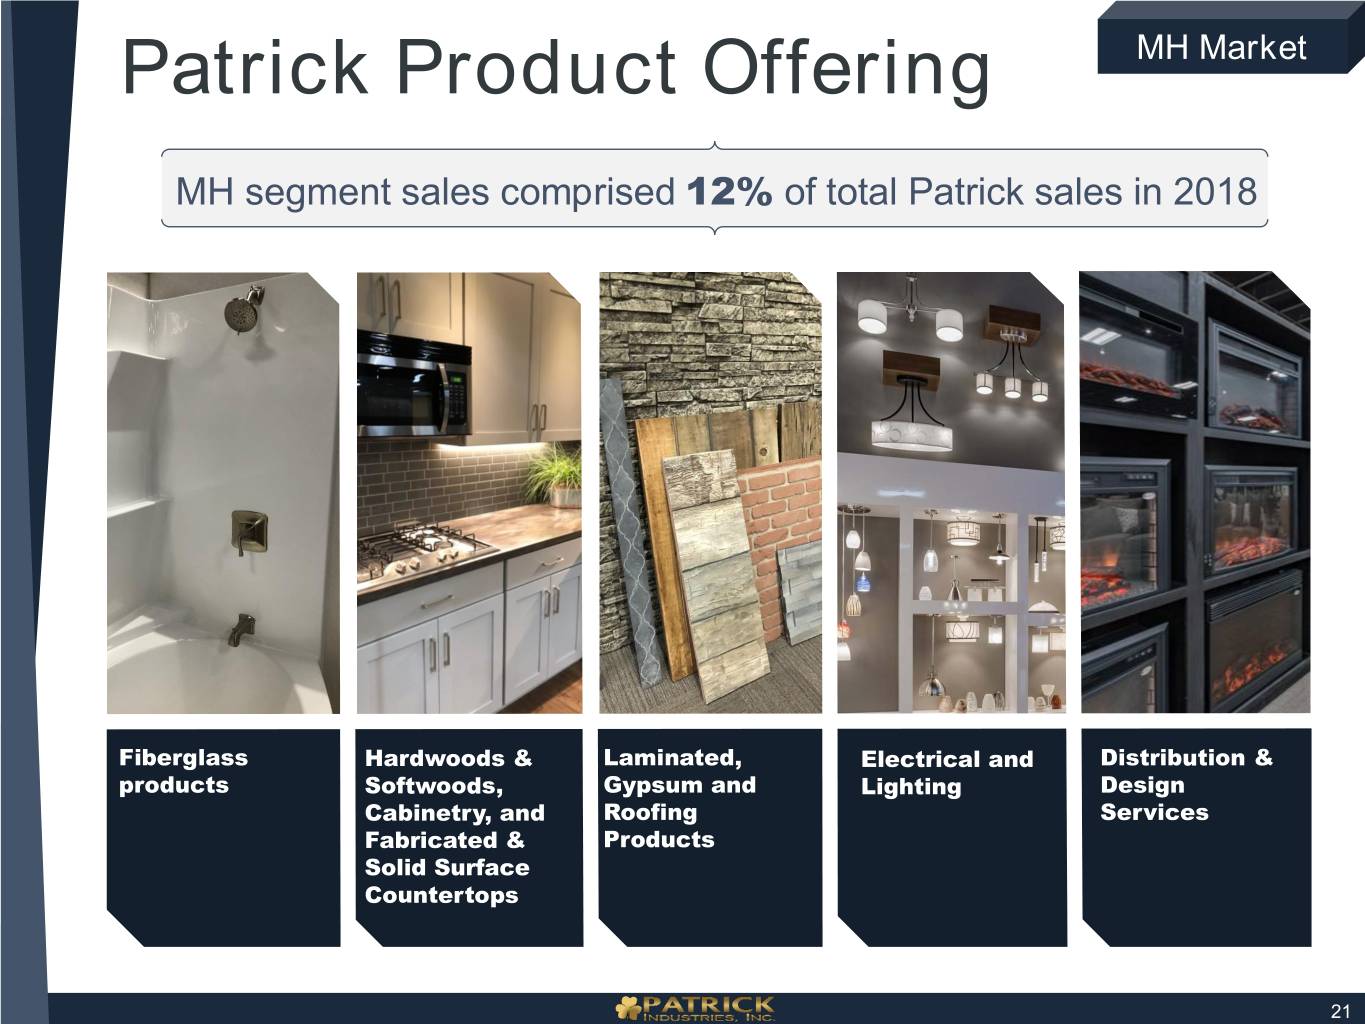
Patrick Product Offering MH Market MH segment sales comprised 12% of total Patrick sales in 2018 Fiberglass Hardwoods & Laminated, Electrical and Distribution & products Softwoods, Gypsum and Lighting Design Cabinetry, and Roofing Services Fabricated & Products Solid Surface Countertops 21
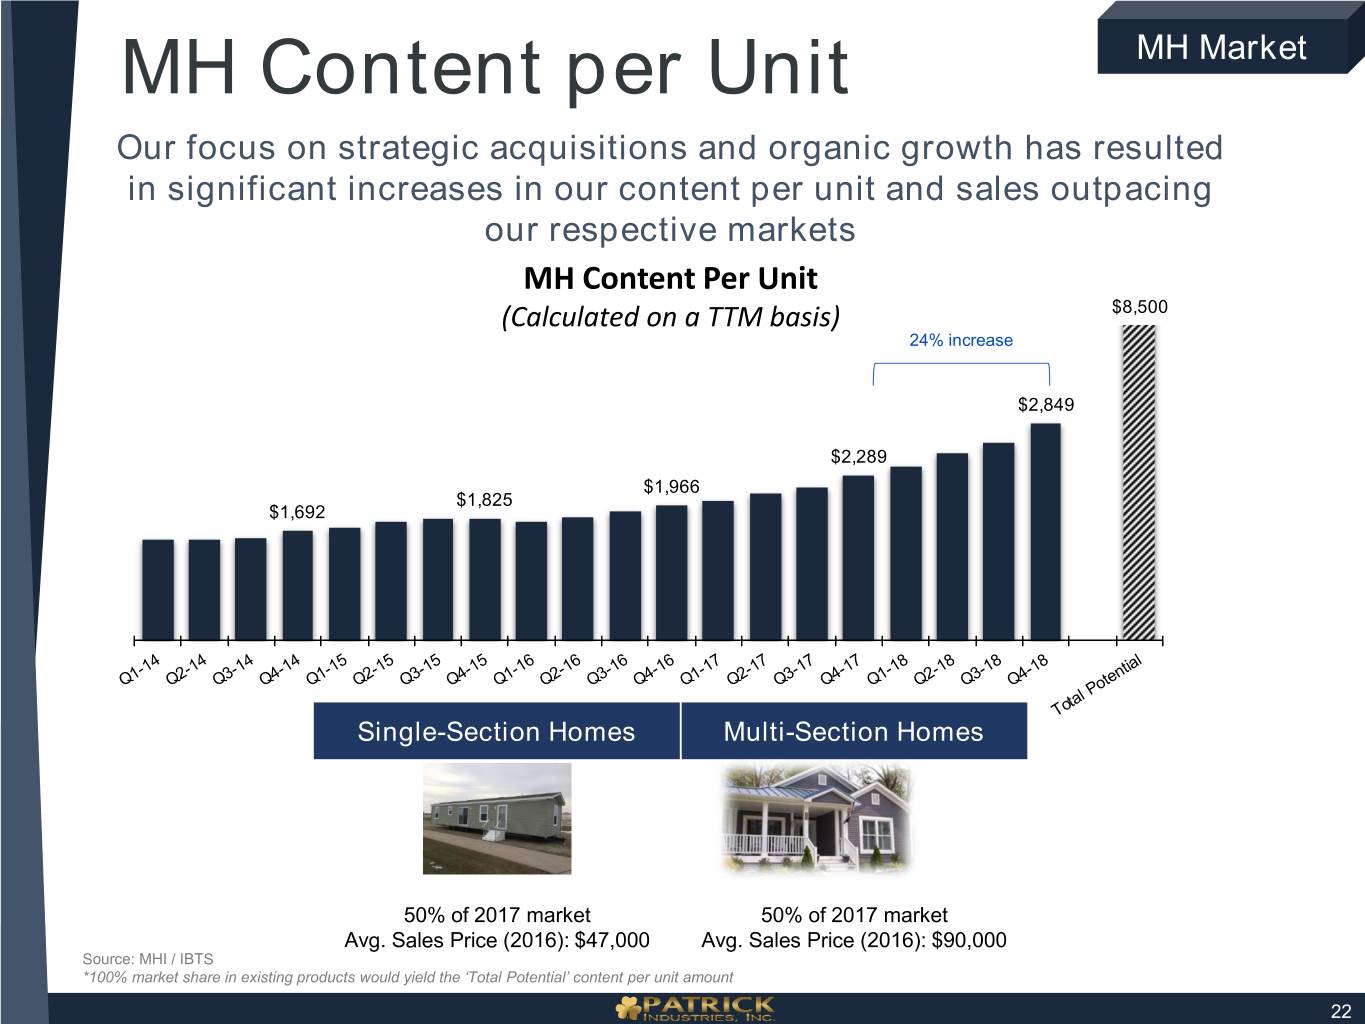
MH Content per Unit MH Market Our focus on strategic acquisitions and organic growth has resulted in significant increases in our content per unit and sales outpacing our respective markets MH Content Per Unit (Calculated on a TTM basis) $8,500 24% increase $2,849 $2,289 $1,966 $1,825 $1,692 Single-Section Homes Multi-Section Homes 50% of 2017 market 50% of 2017 market Avg. Sales Price (2016): $47,000 Avg. Sales Price (2016): $90,000 Source: MHI / IBTS *100% market share in existing products would yield the ‘Total Potential’ content per unit amount 22
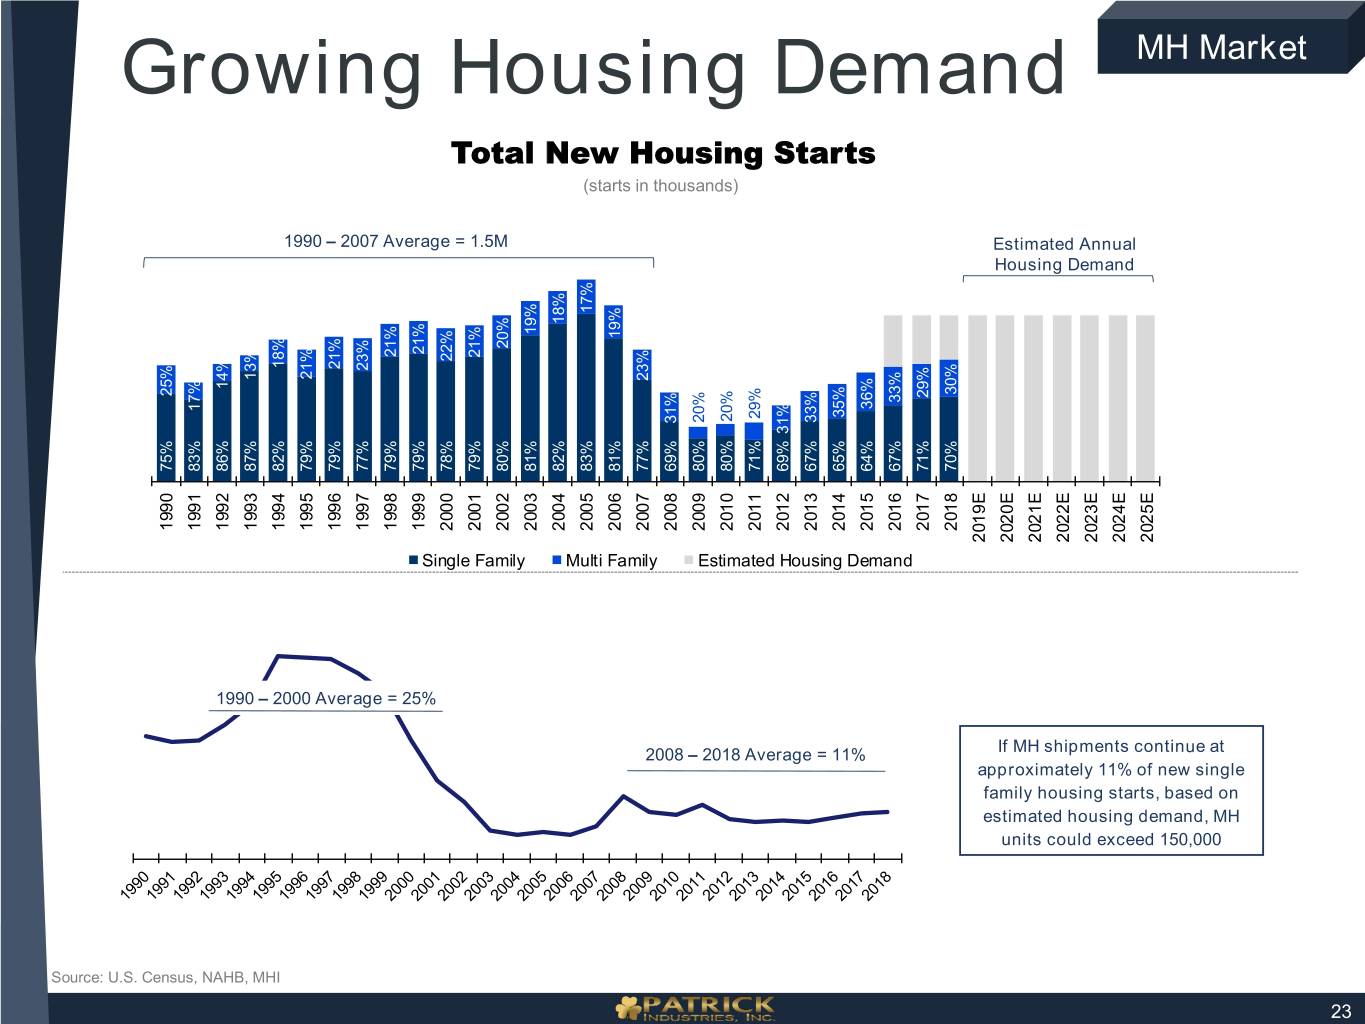
Source: U.S. NAHB, U.S. Census, Source: MHI GrowingHousing Demand 1990 75% 25% 1991 83% 17% 1990 1992 86% 14% – 1993 87% 13% 2000 2000 25% Average= 1994 82% 18% 1990 1995 79% 21% – 1996 79% 21% 2007 1.5M Average= 1997 77% 23% 1998 79% 21% Single FamilySingle 1999 79% 21% 2000 78% 22% Total Starts Housing New 2001 79% 21% 2002 80% 20% 2003 81% 19% Multi FamilyMulti 2004 82% 18% 2005 83% 17% (starts 2006 81% 19% in in thousands) 2008 2007 77% 23% 2008 69% 31% – Estimated HousingEstimated Demand 2018 2018 11% Average= 2009 80% 20% 2010 80% 20% 2011 71% 29% 2012 69% 31% 2013 67% 33% 2014 65% 35% 2015 64% 36% 2016 67% 33% 2017 71% 29% 2018 70% 30% approximately 11% of new approximatelynew 11%of single estimated estimated housing demand, MH family starts, based housing on 2019E Estimated Estimated Annual Housing Housing Demand If MH shipments MH If shipments continue at units could exceed units could exceed 150,000 2020E 2021E 2022E 2023E 2024E MH Market 2025E 23
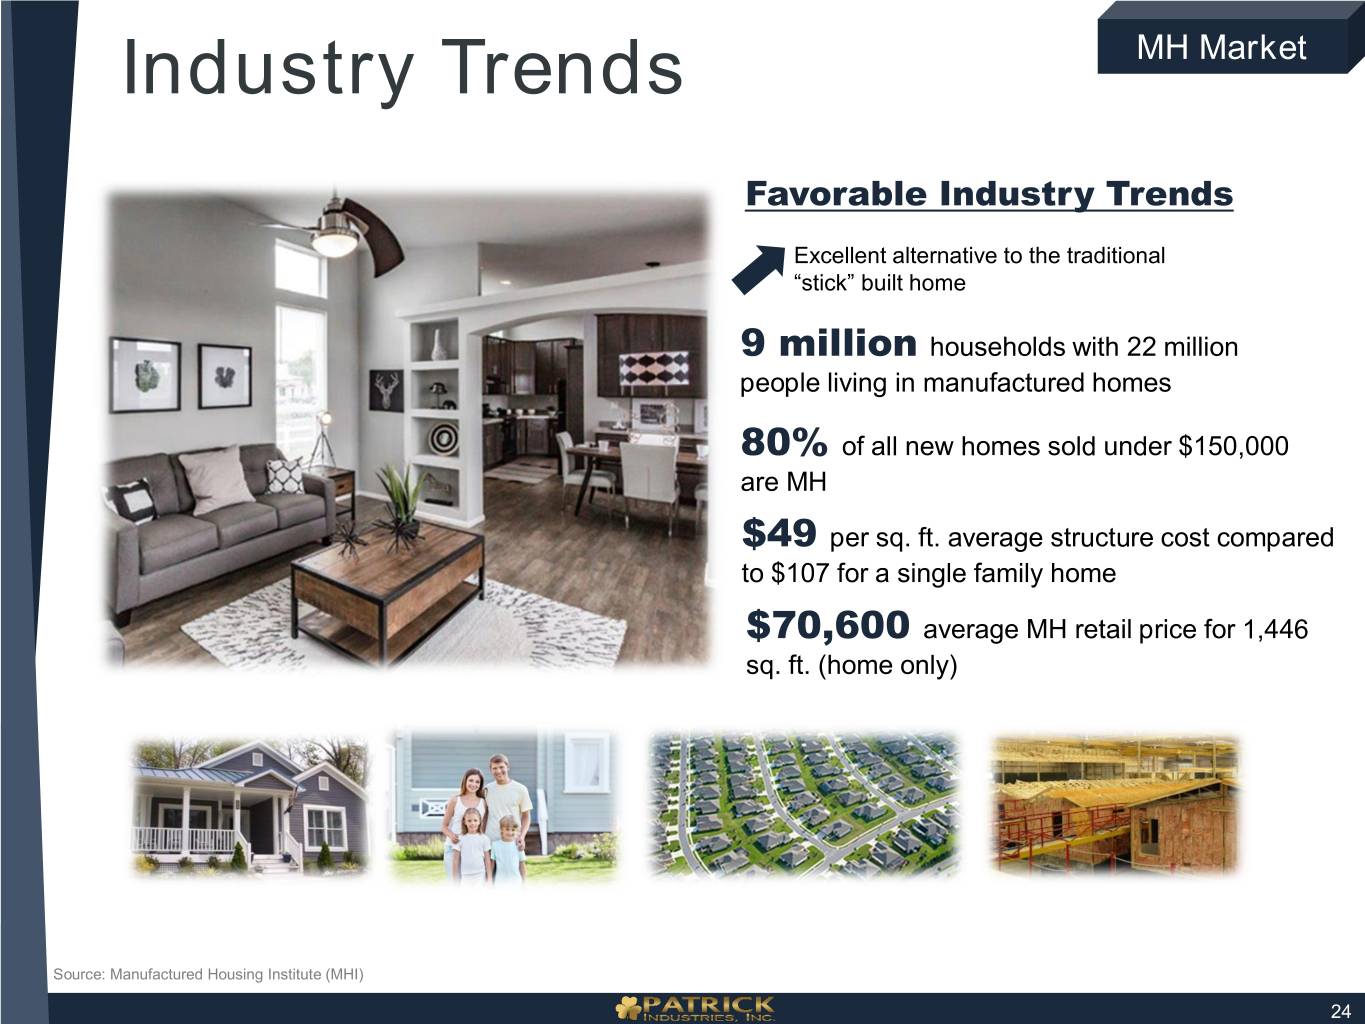
Industry Trends MH Market Favorable Industry Trends Excellent alternative to the traditional “stick” built home 9 million households with 22 million people living in manufactured homes 80% of all new homes sold under $150,000 are MH $49 per sq. ft. average structure cost compared to $107 for a single family home $70,600 average MH retail price for 1,446 sq. ft. (home only) Source: Manufactured Housing Institute (MHI) 24
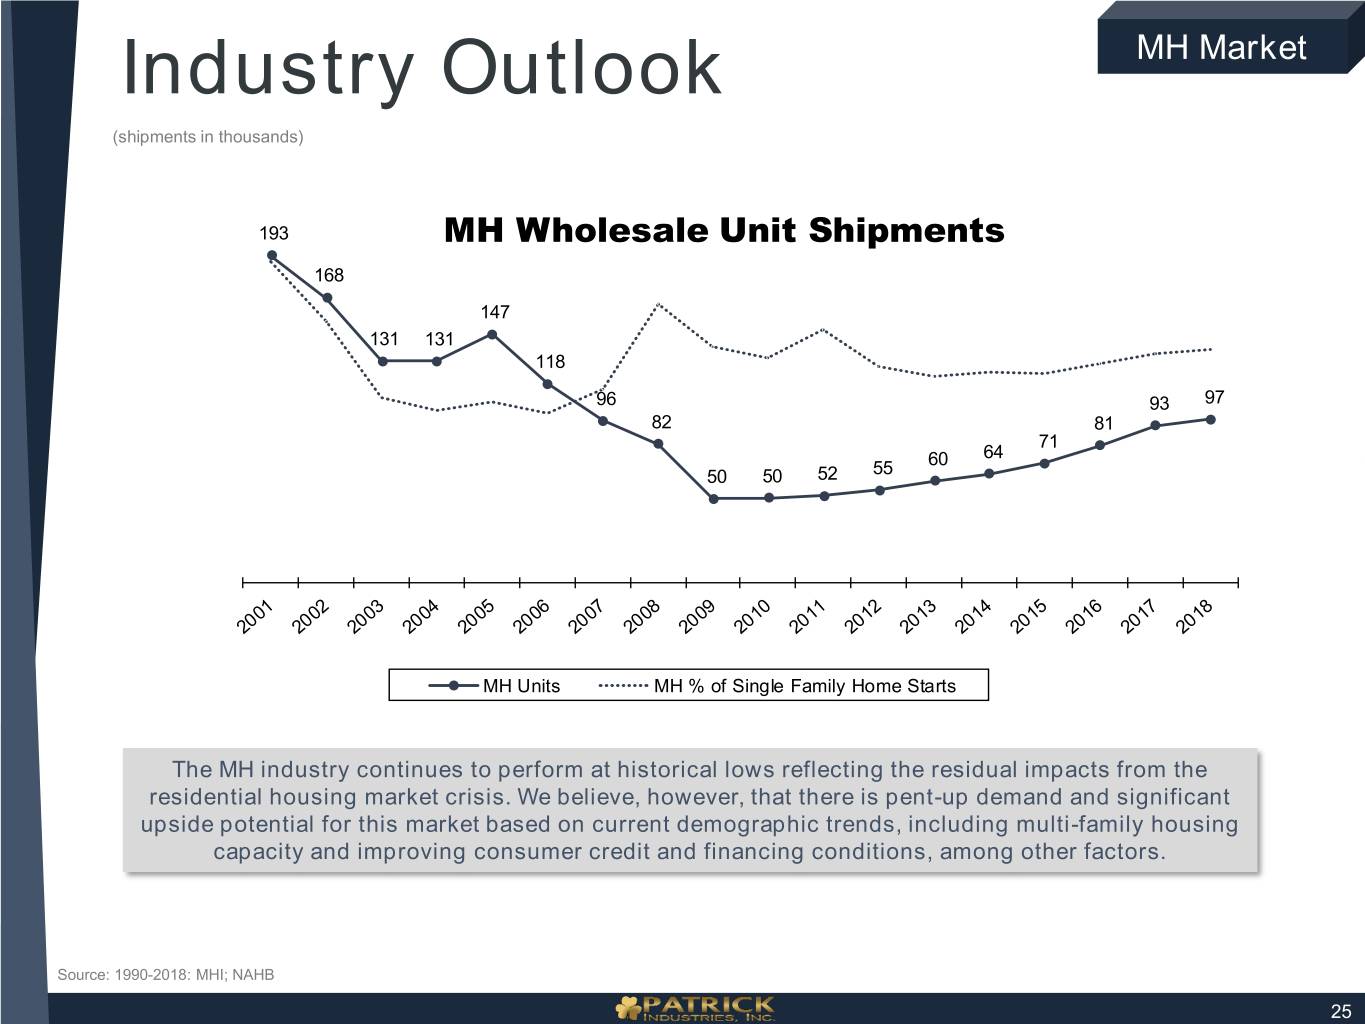
Industry Outlook MH Market (shipments in thousands) 193 MH Wholesale Unit Shipments 168 147 131 131 118 96 93 97 82 81 71 60 64 50 50 52 55 MH Units MH % of Single Family Home Starts The MH industry continues to perform at historical lows reflecting the residual impacts from the residential housing market crisis. We believe, however, that there is pent-up demand and significant upside potential for this market based on current demographic trends, including multi-family housing capacity and improving consumer credit and financing conditions, among other factors. Source: 1990-2018: MHI; NAHB 25
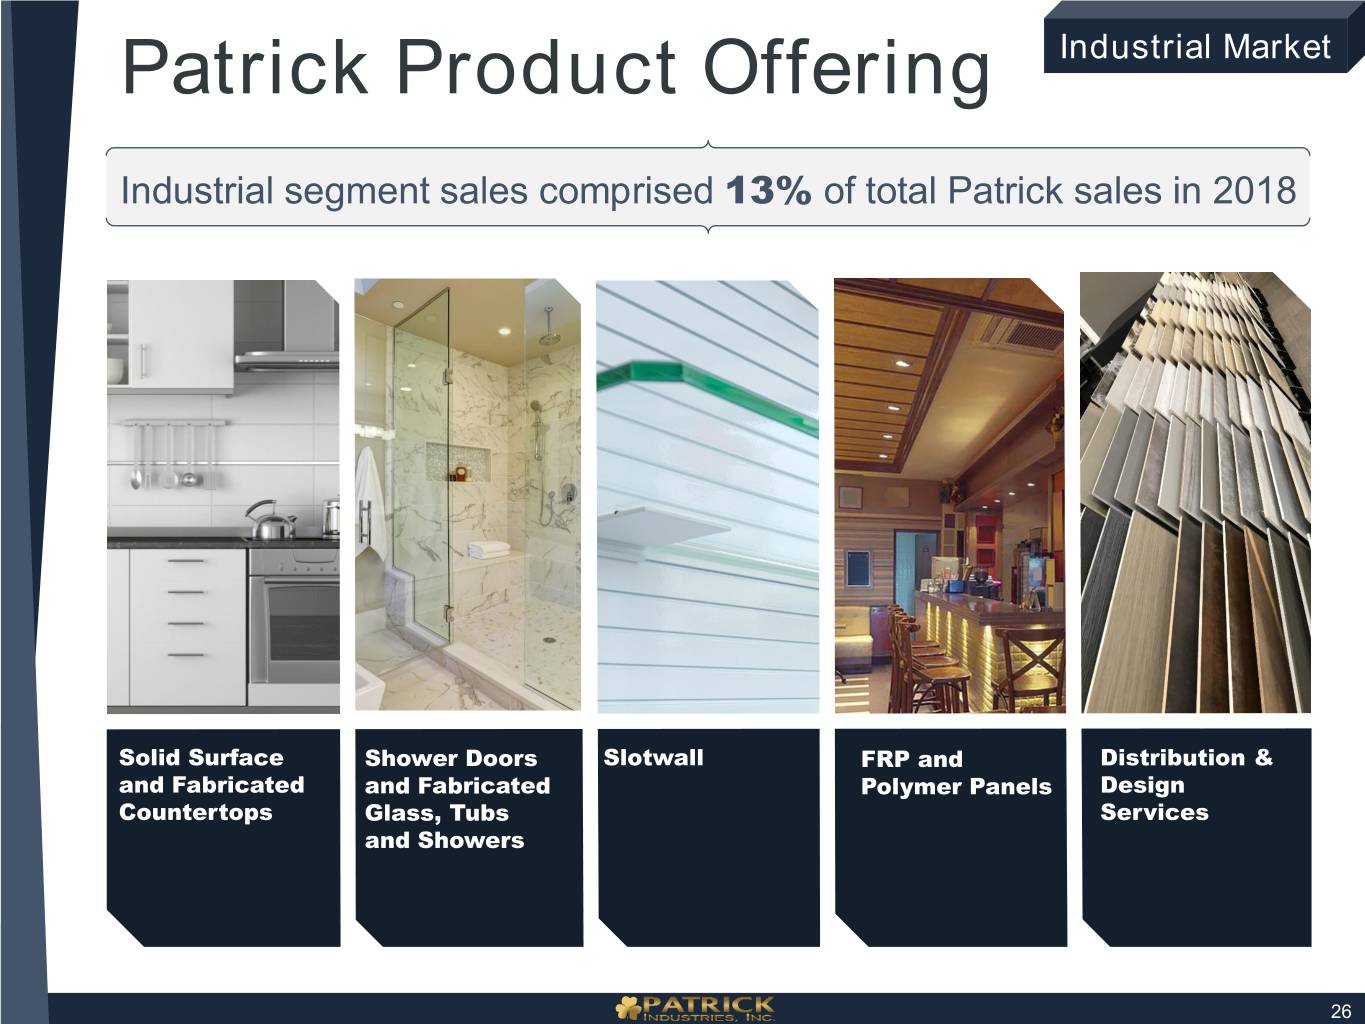
Patrick Product Offering Industrial Market Industrial segment sales comprised 13% of total Patrick sales in 2018 Solid Surface Shower Doors Slotwall FRP and Distribution & and Fabricated and Fabricated Polymer Panels Design Countertops Glass, Tubs Services and Showers 26
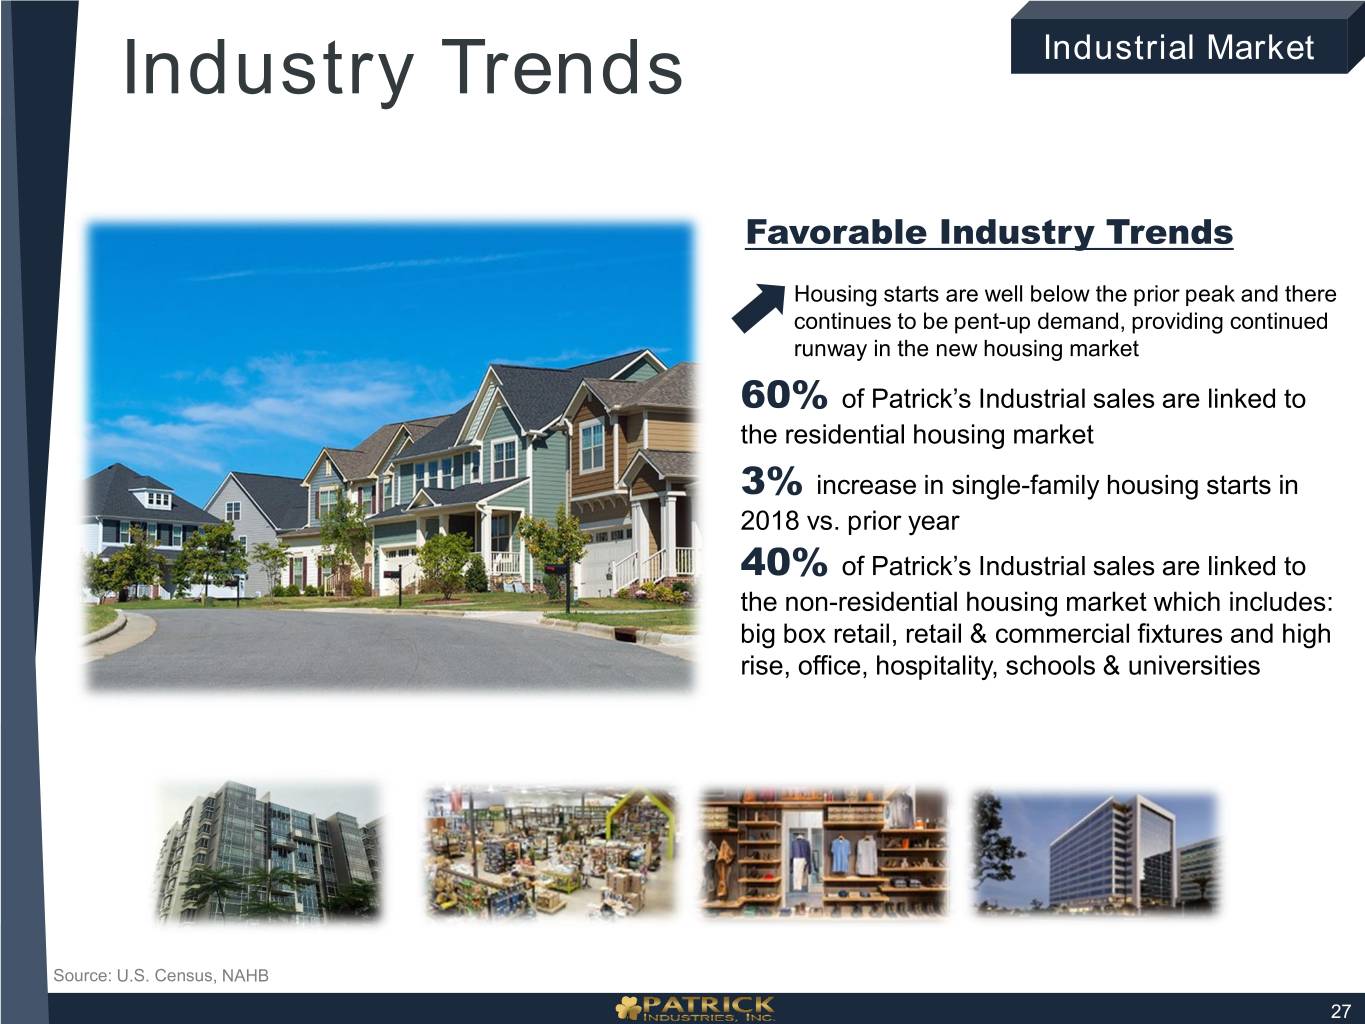
Industry Trends Industrial Market Favorable Industry Trends Housing starts are well below the prior peak and there continues to be pent-up demand, providing continued runway in the new housing market 60% of Patrick’s Industrial sales are linked to the residential housing market 3% increase in single-family housing starts in 2018 vs. prior year 40% of Patrick’s Industrial sales are linked to the non-residential housing market which includes: big box retail, retail & commercial fixtures and high rise, office, hospitality, schools & universities Source: U.S. Census, NAHB 27
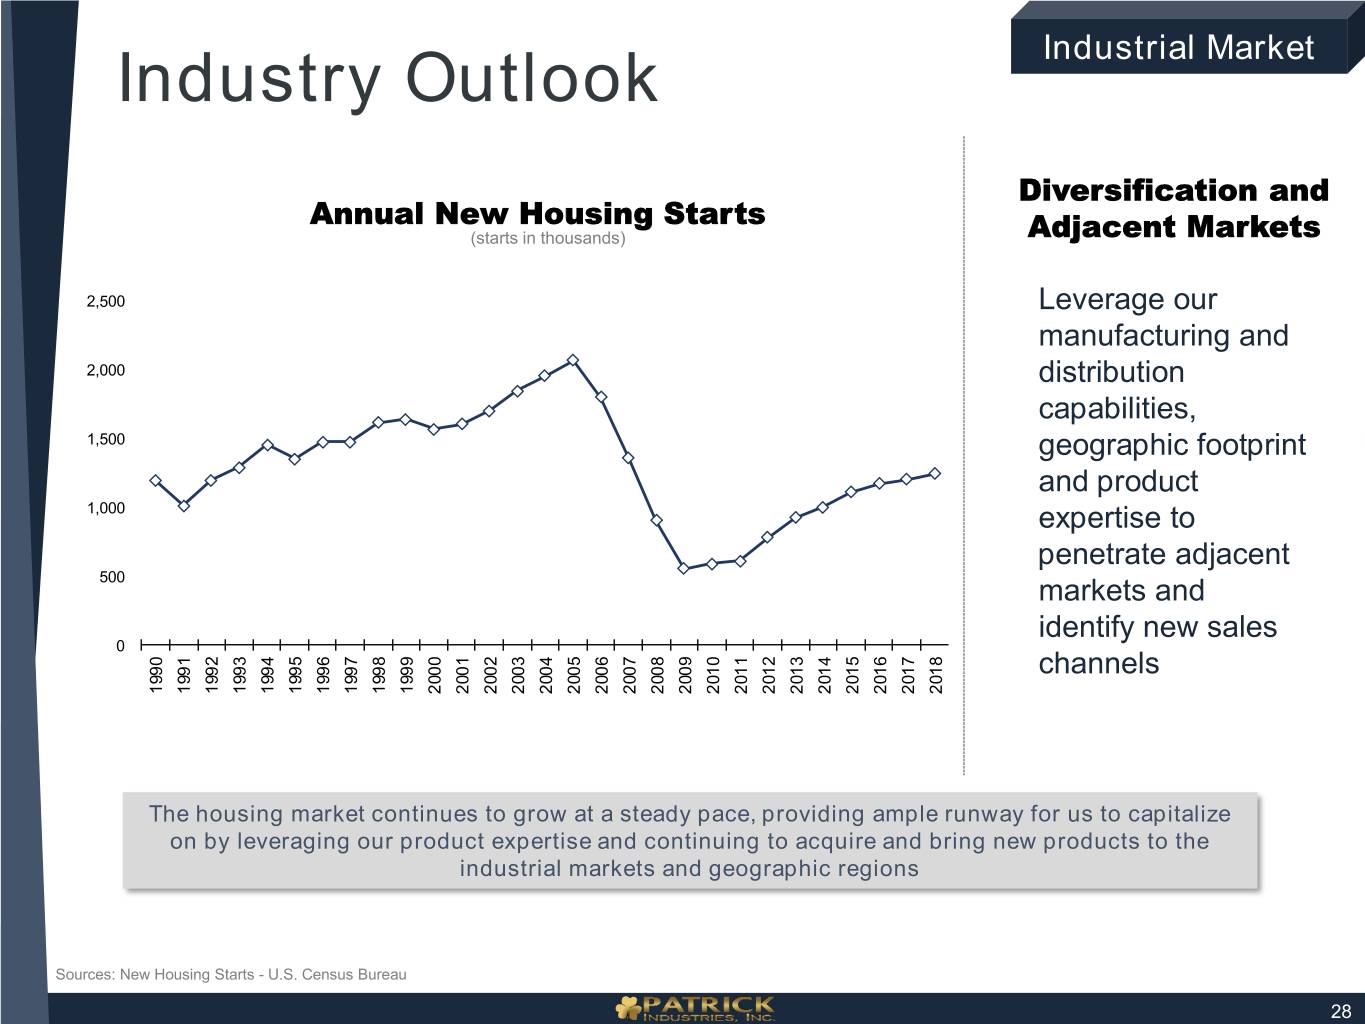
Industry Outlook Industrial Market Diversification and Annual New Housing Starts (starts in thousands) Adjacent Markets 2,500 Leverage our manufacturing and 2,000 distribution capabilities, 1,500 geographic footprint and product 1,000 expertise to penetrate adjacent 500 markets and identify new sales 0 channels 1990 1991 1992 1993 1994 1995 1996 1997 1998 1999 2000 2001 2002 2003 2004 2005 2006 2007 2008 2009 2010 2011 2012 2013 2014 2015 2016 2017 2018 The housing market continues to grow at a steady pace, providing ample runway for us to capitalize on by leveraging our product expertise and continuing to acquire and bring new products to the industrial markets and geographic regions Sources: New Housing Starts - U.S. Census Bureau 28

Growth Initiatives & Capital Allocation Strategy
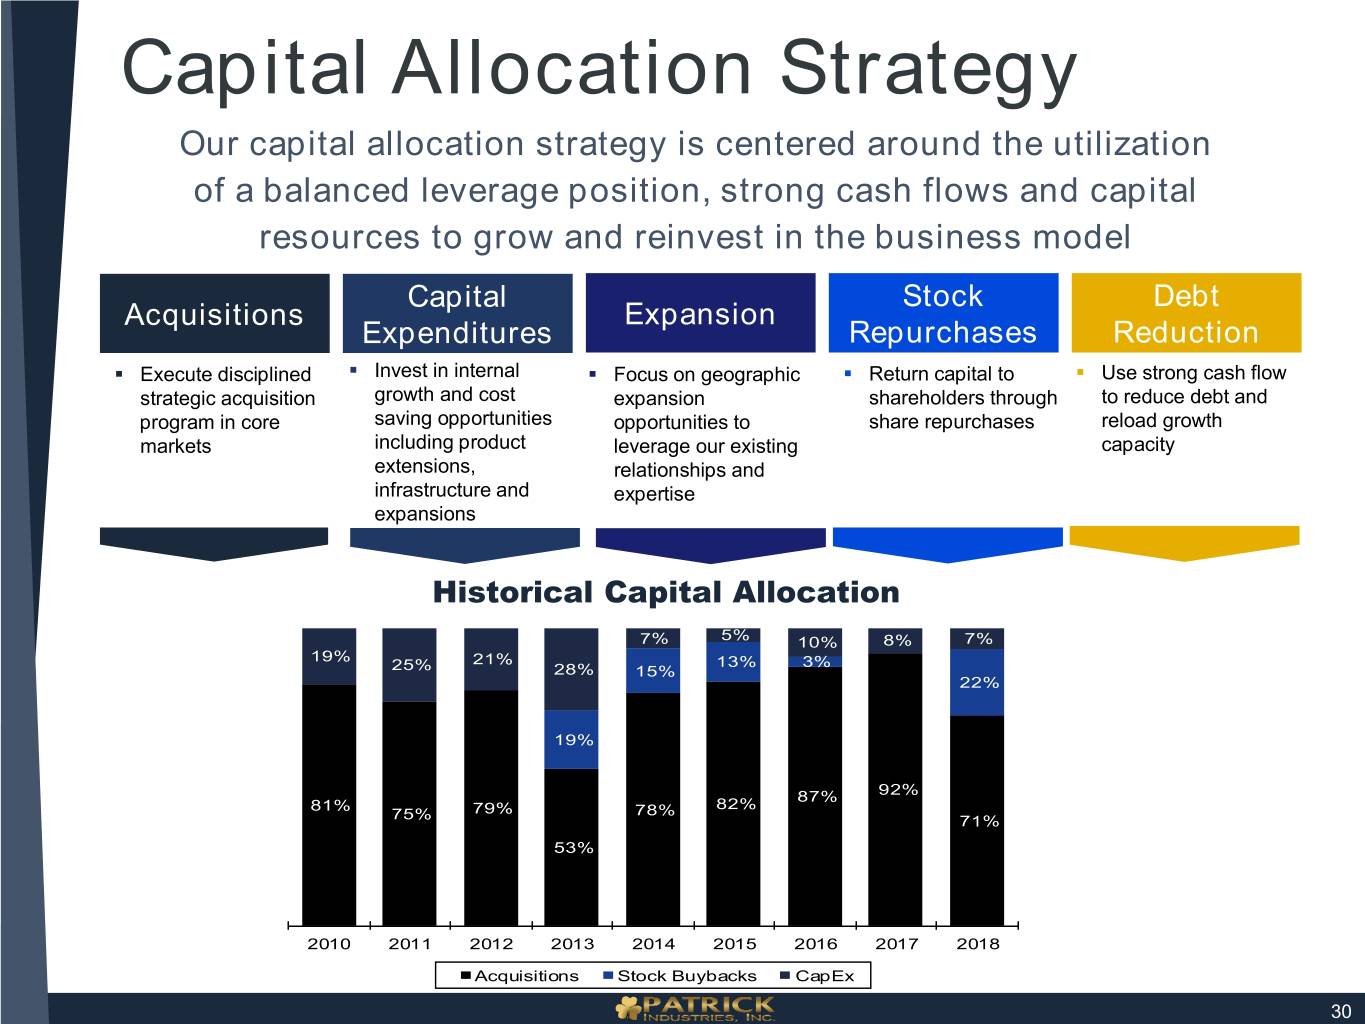
Capital Allocation Strategy Our capital allocation strategy is centered around the utilization of a balanced leverage position, strong cash flows and capital resources to grow and reinvest in the business model Capital Stock Debt Acquisitions Expansion Expenditures Repurchases Reduction . . . Execute disciplined Invest in internal . Focus on geographic . Return capital to Use strong cash flow strategic acquisition growth and cost expansion shareholders through to reduce debt and program in core saving opportunities opportunities to share repurchases reload growth markets including product leverage our existing capacity extensions, relationships and infrastructure and expertise expansions Historical Capital Allocation 7% 5% 10% 8% 7% 19% 21% 13% 3% 25% 28% 15% 22% 19% 87% 92% 81% 79% 78% 82% 75% 71% 53% 2010 2011 2012 2013 2014 2015 2016 2017 2018 Acquisitions Stock Buybacks CapEx 30
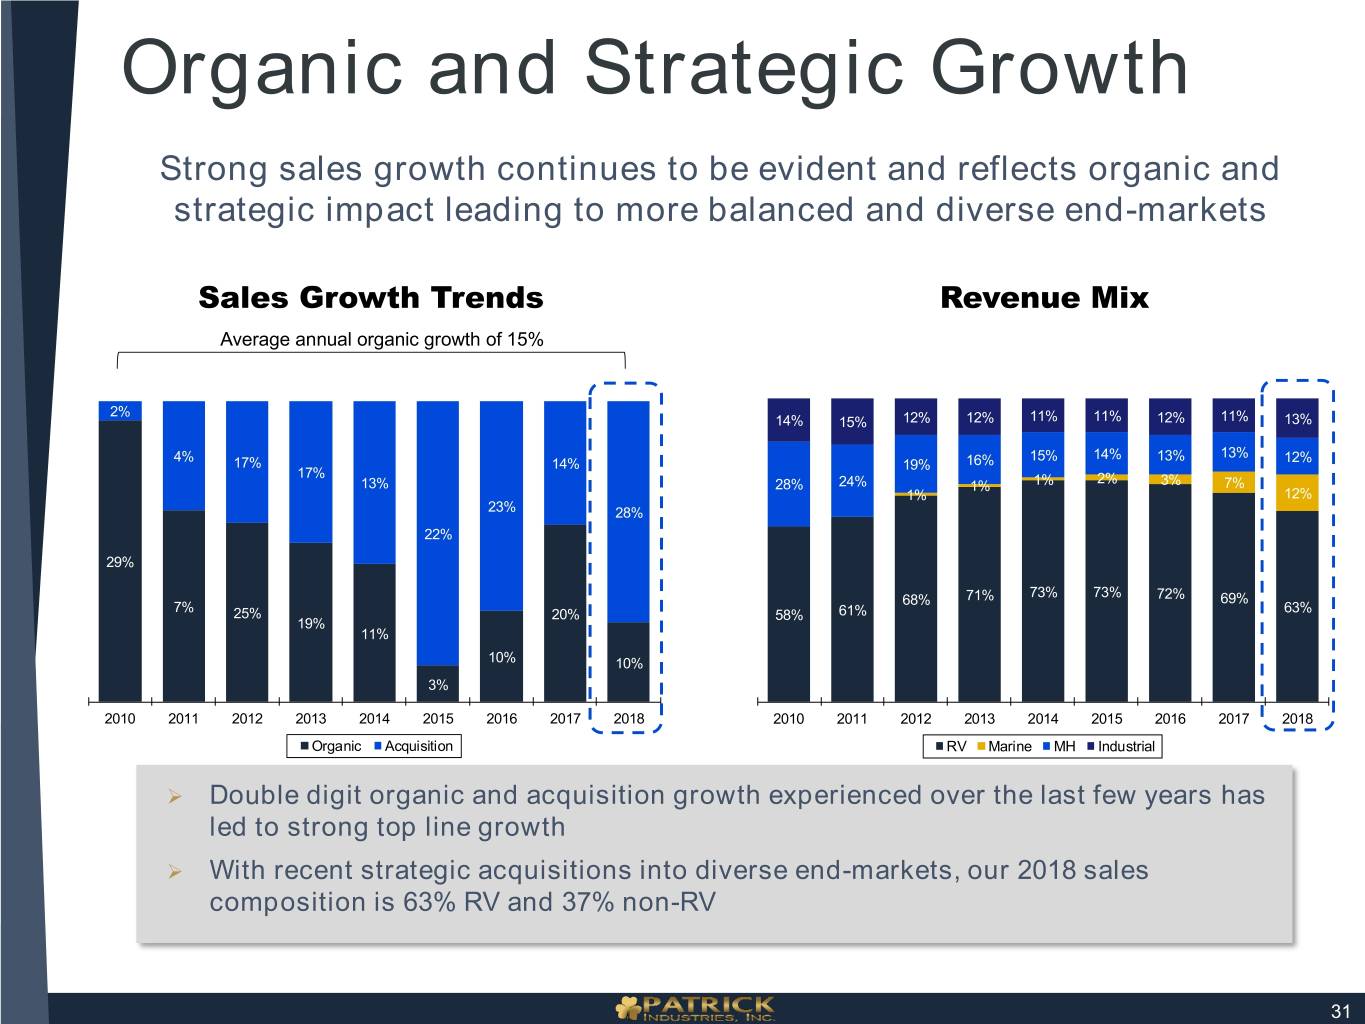
Organic and Strategic Growth Strong sales growth continues to be evident and reflects organic and strategic impact leading to more balanced and diverse end-markets Sales Growth Trends Revenue Mix Average annual organic growth of 15% 2% 14% 15% 12% 12% 11% 11% 12% 11% 13% 4% 15% 14% 13% 13% 12% 17% 14% 19% 16% 17% 2% 13% 28% 24% 1% 1% 3% 7% 1% 12% 23% 28% 22% 29% 73% 73% 68% 71% 72% 69% 7% 63% 25% 20% 58% 61% 19% 11% 10% 10% 3% 2010 2011 2012 2013 2014 2015 2016 2017 2018 2010 2011 2012 2013 2014 2015 2016 2017 2018 Organic Acquisition RV Marine MH Industrial Double digit organic and acquisition growth experienced over the last few years has led to strong top line growth With recent strategic acquisitions into diverse end-markets, our 2018 sales composition is 63% RV and 37% non-RV 31
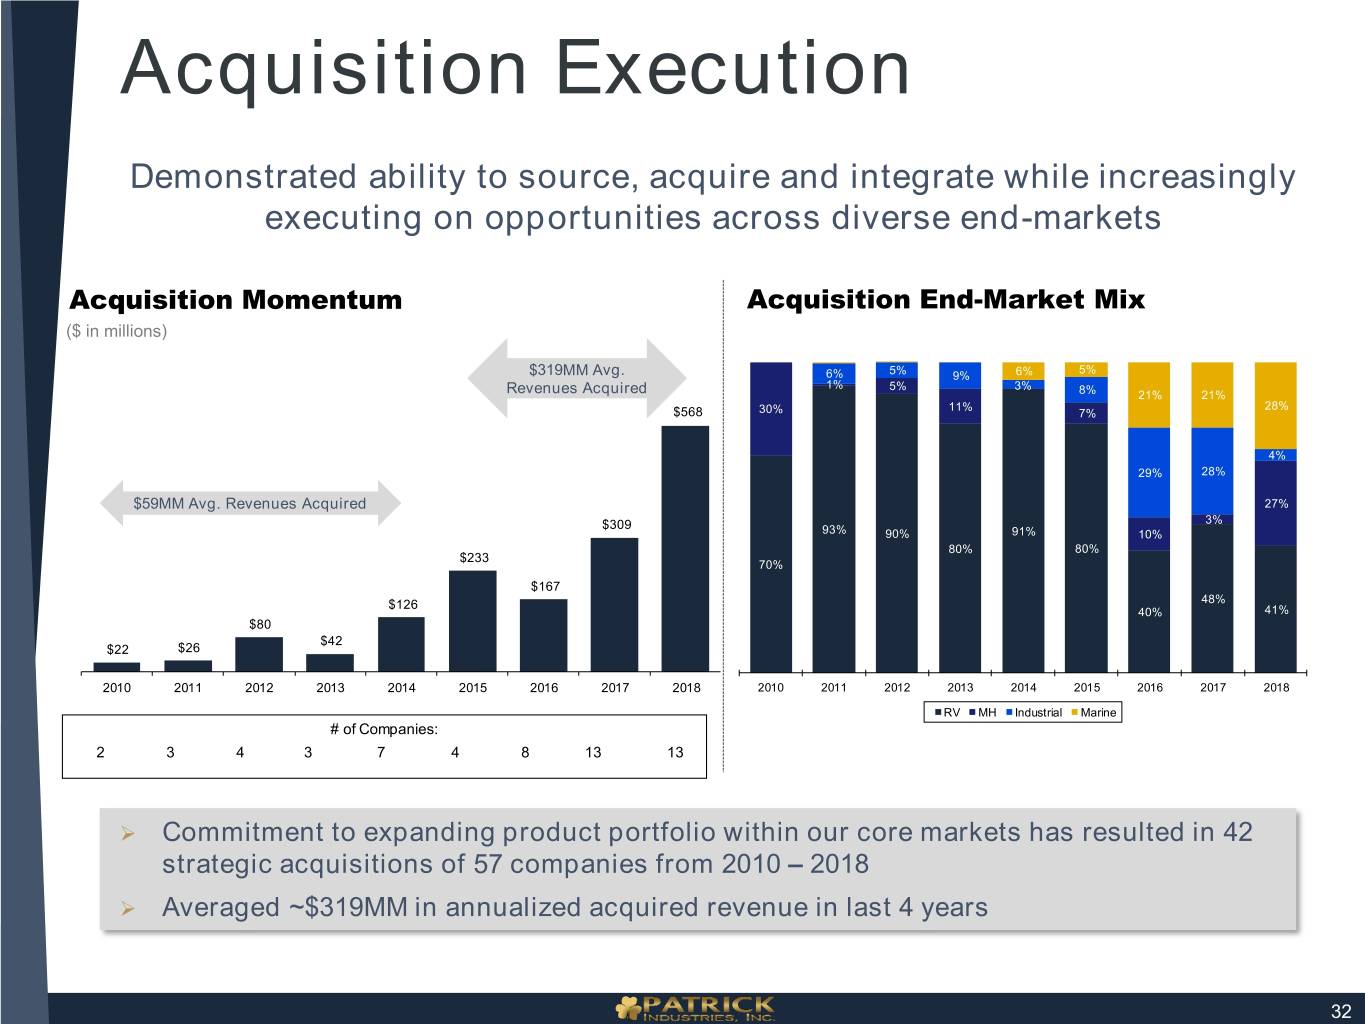
Acquisition Execution Demonstrated ability to source, acquire and integrate while increasingly executing on opportunities across diverse end-markets Acquisition Momentum Acquisition End-Market Mix ($ in millions) 5% $319MM Avg. 6% 5% 9% 6% 1% 5% 3% Revenues Acquired 8% 21% 21% 11% 28% $568 30% 7% 4% 29% 28% $59MM Avg. Revenues Acquired 27% $309 3% 93% 90% 91% 10% 80% 80% $233 70% $167 $126 48% 40% 41% $80 $42 $22 $26 2010 2011 2012 2013 2014 2015 2016 2017 2018 2010 2011 2012 2013 2014 2015 2016 2017 2018 RV MH Industrial Marine # of Companies: 2 3 4 3 7 4 8 13 13 Commitment to expanding product portfolio within our core markets has resulted in 42 strategic acquisitions of 57 companies from 2010 – 2018 Averaged ~$319MM in annualized acquired revenue in last 4 years 32
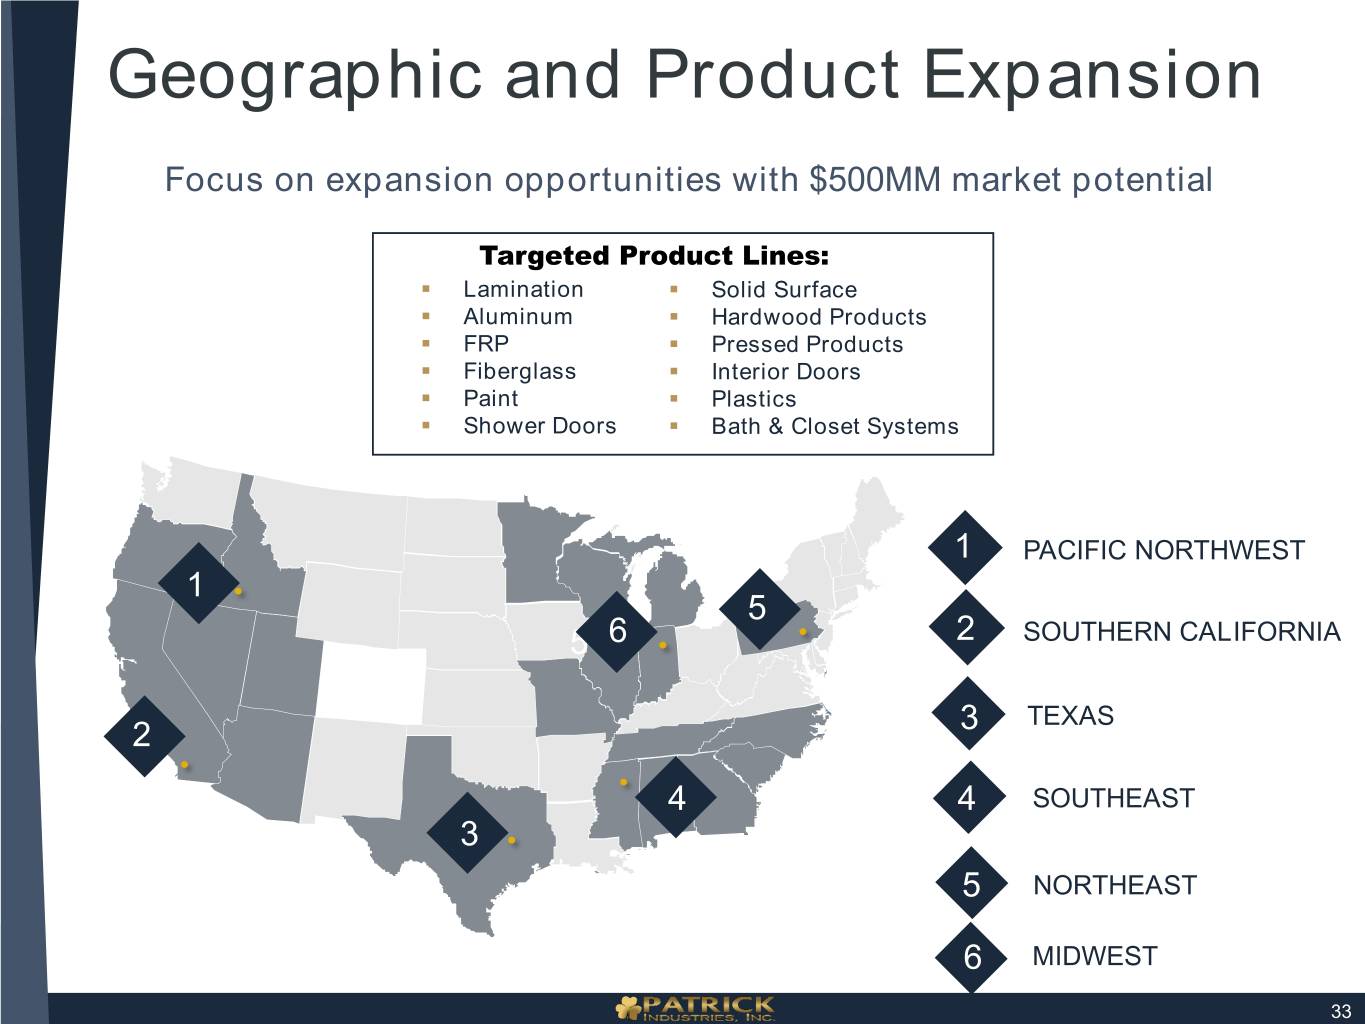
Geographic and Product Expansion Focus on expansion opportunities with $500MM market potential Targeted Product Lines: . Lamination . Solid Surface . Aluminum . Hardwood Products . FRP . Pressed Products . Fiberglass . Interior Doors . Paint . Plastics . Shower Doors . Bath & Closet Systems 1 PACIFIC NORTHWEST 1 5 5 6 2 SOUTHERN CALIFORNIA TEXAS 2 3 4 4 SOUTHEAST 3 5 NORTHEAST 6 MIDWEST 33
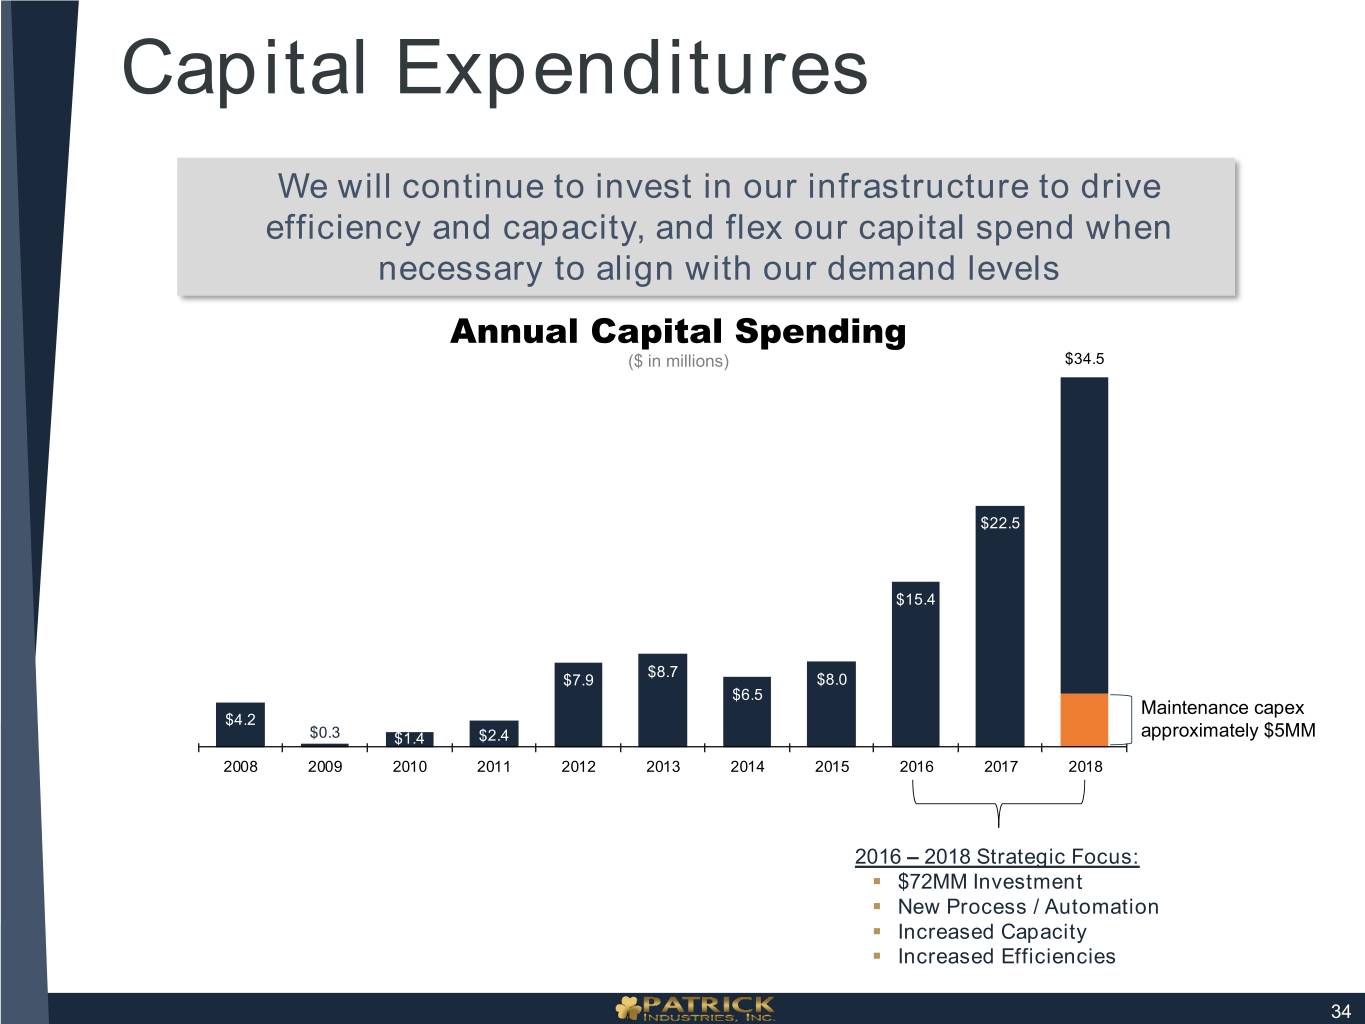
Capital Expenditures We will continue to invest in our infrastructure to drive efficiency and capacity, and flex our capital spend when necessary to align with our demand levels Annual Capital Spending ($ in millions) $34.5 $22.5 $15.4 $8.7 $7.9 $8.0 $6.5 Maintenance capex $4.2 $0.3 $1.4 $2.4 approximately $5MM 2008 2009 2010 2011 2012 2013 2014 2015 2016 2017 2018 2016 – 2018 Strategic Focus: . $72MM Investment . New Process / Automation . Increased Capacity . Increased Efficiencies 34
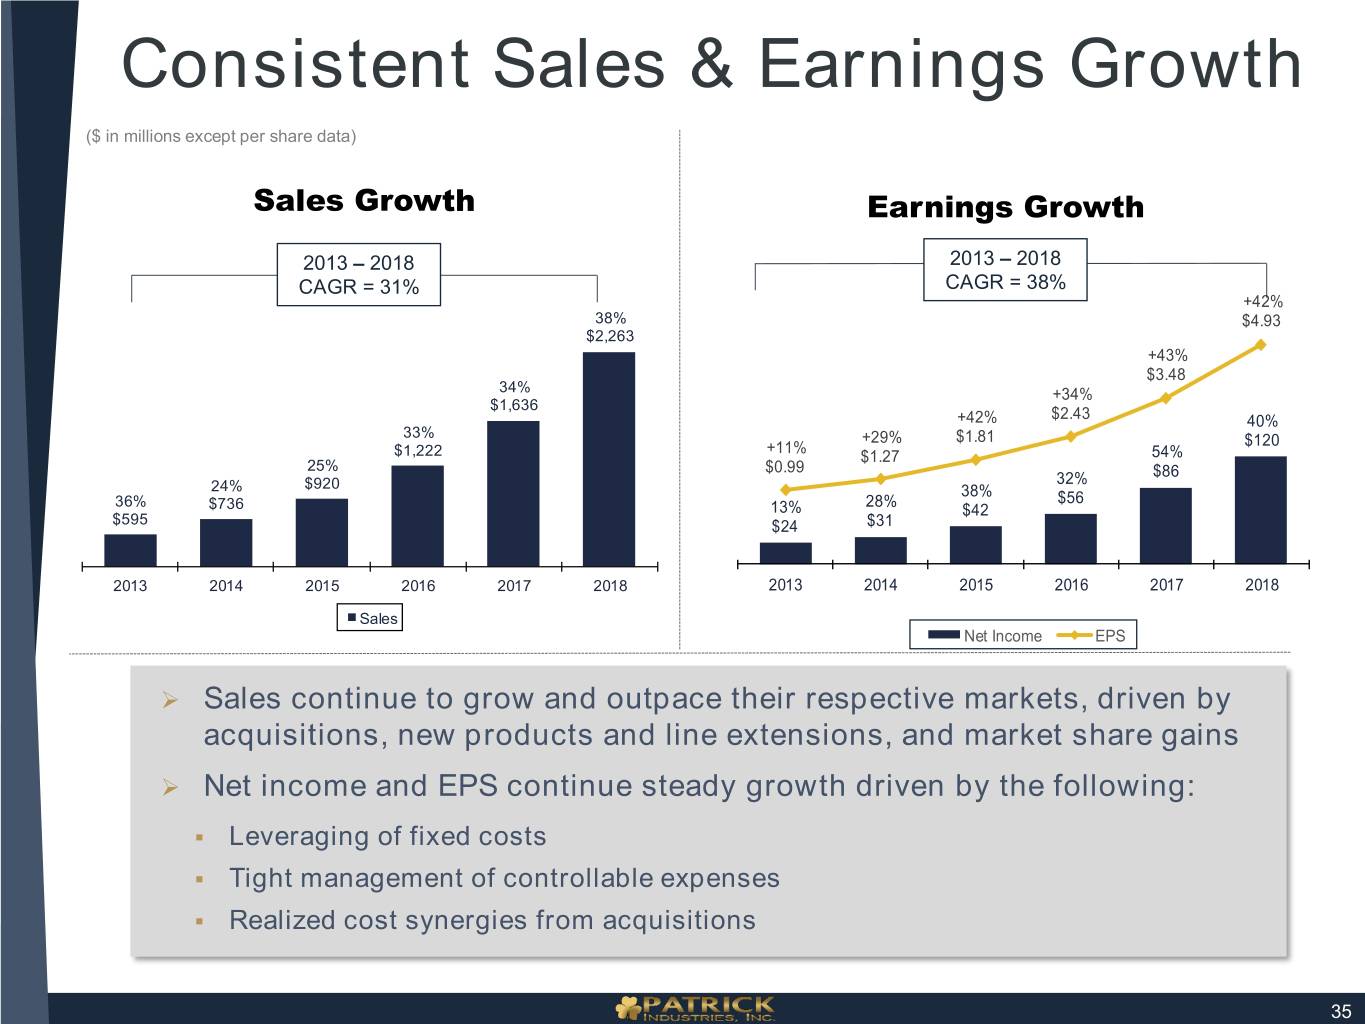
Consistent Sales & Earnings Growth ($ in millions except per share data) Sales Growth Earnings Growth 2013 – 2018 2013 – 2018 CAGR = 31% CAGR = 38% +42% 38% $4.93 $2,263 +43% $3.48 34% +34% $1,636 +42% $2.43 40% 33% +29% $1.81 +11% $120 $1,222 $1.27 54% 25% $0.99 32% $86 24% $920 38% 36% 28% $56 $736 13% $42 $595 $24 $31 2013 2014 2015 2016 2017 2018 2013 2014 2015 2016 2017 2018 Sales Net Income EPS Sales continue to grow and outpace their respective markets, driven by acquisitions, new products and line extensions, and market share gains Net income and EPS continue steady growth driven by the following: . Leveraging of fixed costs . Tight management of controllable expenses . Realized cost synergies from acquisitions 35
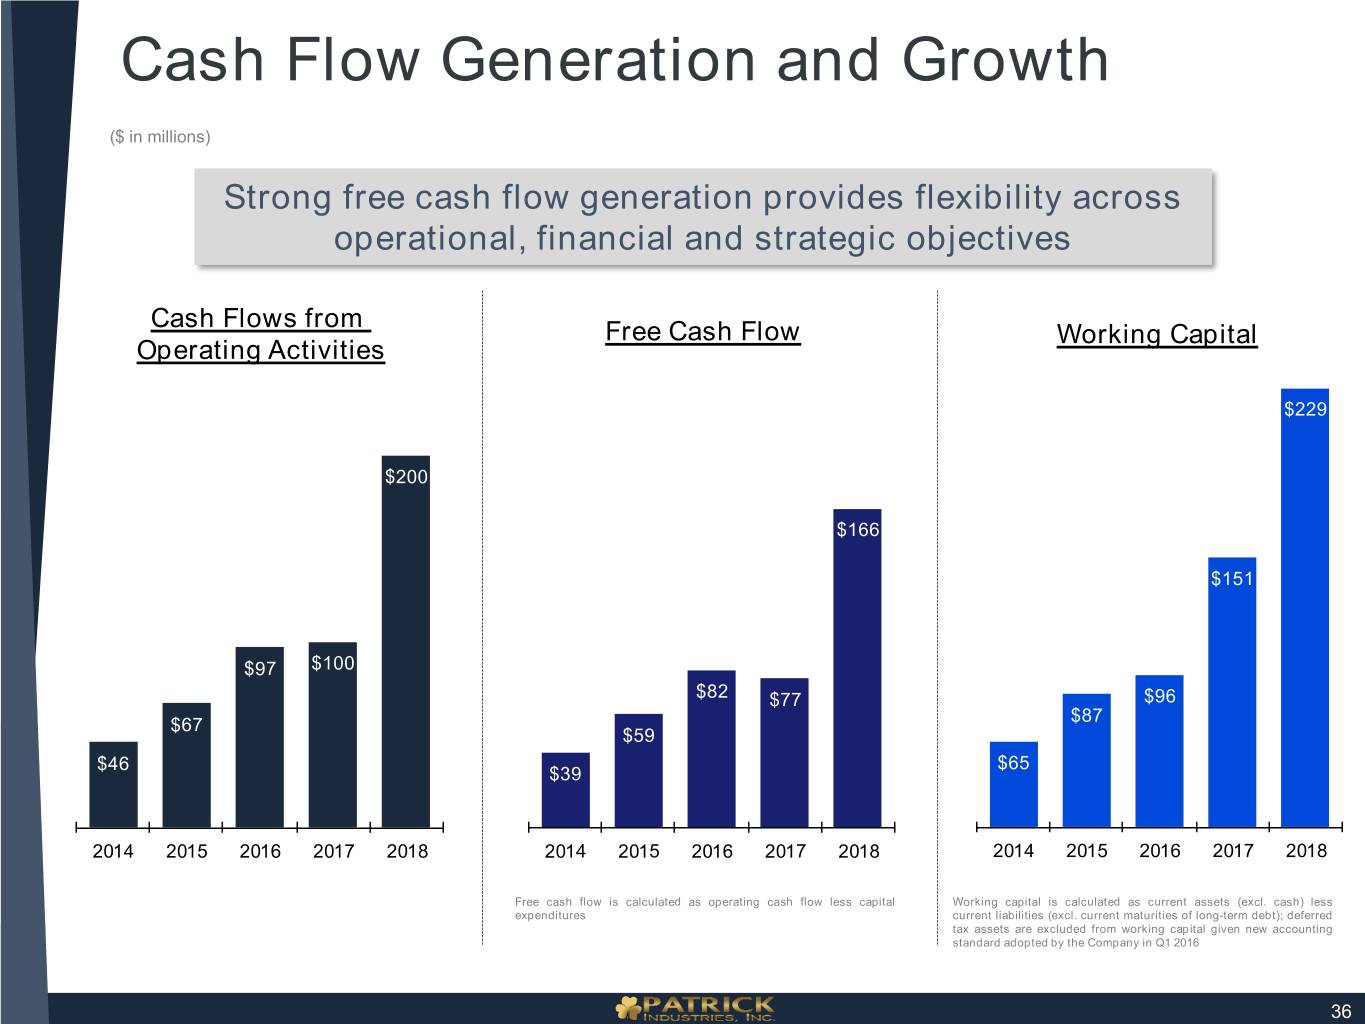
Cash Flow Generation and Growth ($ in millions) Strong free cash flow generation provides flexibility across operational, financial and strategic objectives Cash Flows from Free Cash Flow Working Capital Operating Activities $229 $200 $166 $151 $97 $100 $82 $77 $96 $87 $67 $59 $46 $65 $39 2014 2015 2016 2017 2018 2014 2015 2016 2017 2018 2014 2015 2016 2017 2018 Free cash flow is calculated as operating cash flow less capital Working capital is calculated as current assets (excl. cash) less expenditures current liabilities (excl. current maturities of long-term debt); deferred tax assets are excluded from working capital given new accounting standard adopted by the Company in Q1 2016 36
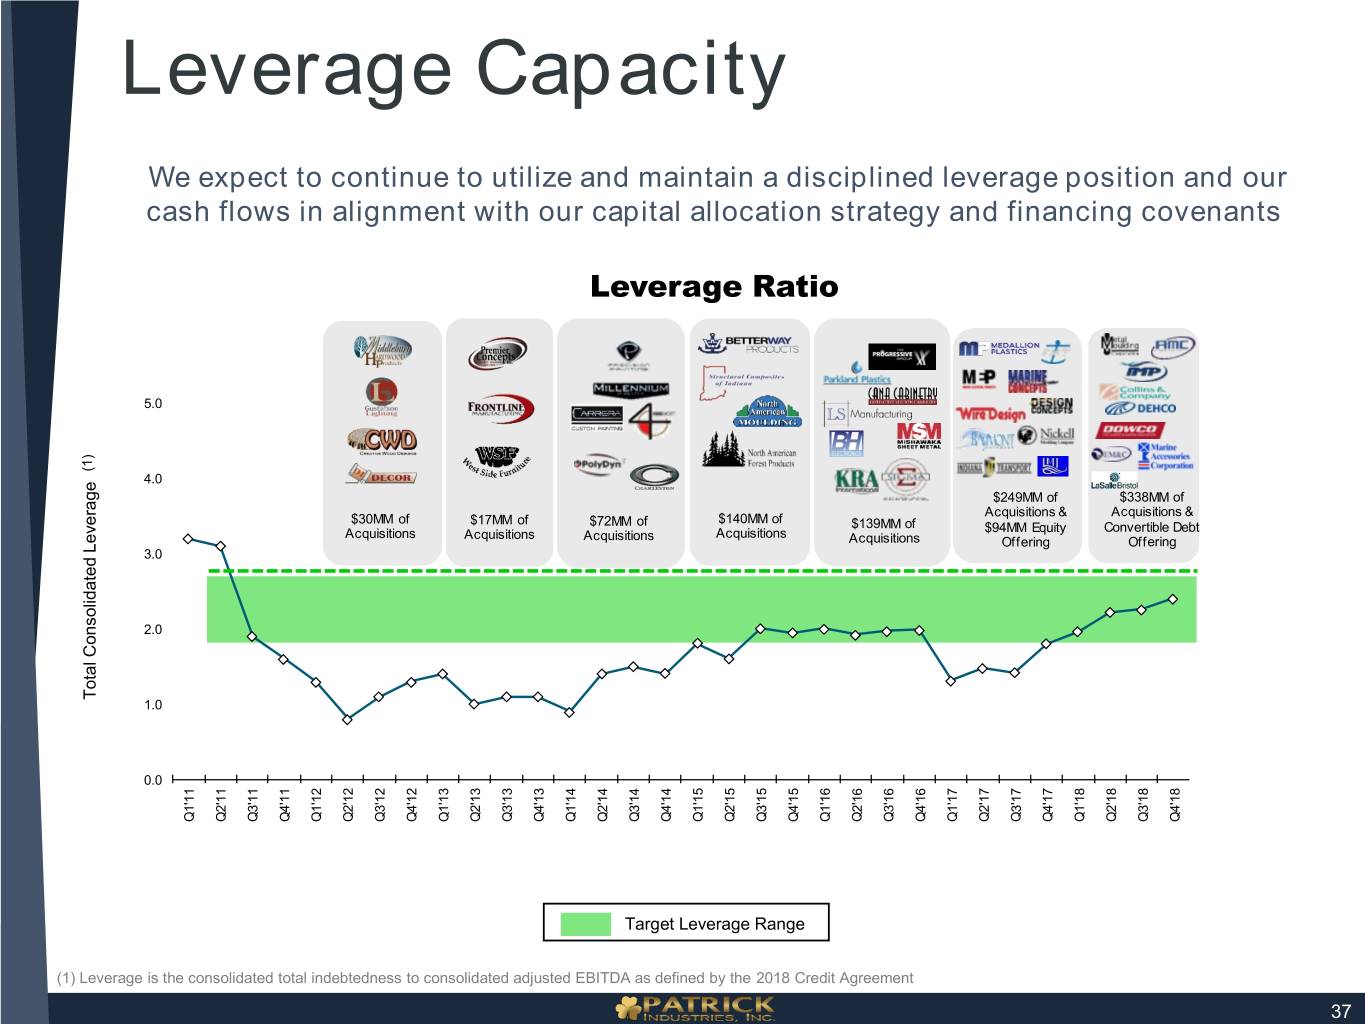
Leverage Capacity We expect to continue to utilize and maintain a disciplined leverage position and our cash flows in alignment with our capital allocation strategy and financing covenants Leverage Ratio 5.0 (1) 4.0 $249MM of $338MM of Acquisitions & Acquisitions & $30MM of $17MM of $140MM of $72MM of $139MM of $94MM Equity Convertible Debt Acquisitions Acquisitions Acquisitions Acquisitions Acquisitions Offering Offering 3.0 2.0 Total Consolidated LeverageConsolidatedTotal 1.0 0.0 Q1'11 Q3'11 Q2'12 Q4'12 Q2'13 Q4'13 Q3'14 Q1'15 Q3'15 Q1'16 Q2'17 Q4'17 Q2'18 Q2'11 Q4'11 Q1'12 Q3'12 Q1'13 Q3'13 Q1'14 Q2'14 Q4'14 Q2'15 Q4'15 Q2'16 Q3'16 Q4'16 Q1'17 Q3'17 Q1'18 Q3'18 Q4'18 Target Leverage Range (1) Leverage is the consolidated total indebtedness to consolidated adjusted EBITDA as defined by the 2018 Credit Agreement 37
