EXHIBIT 99.1
Published on September 19, 2019

August 2019 - Draft p Investor Presentation (Mockup version) Investor Presentation September 2019
Forward-Looking Statements This presentation contains certain statements related to future results or states our intentions, beliefs and expectations or predictions for the future which are forward-looking statements as that term is defined in the Private Securities Litigation Reform Act of 1995. These forward-looking statements are subject to certain risks and uncertainties that could cause actual results to differ materially from either historical or anticipated results depending on a variety of factors. Further information concerning the Company and its business, including factors that potentially could materially affect the Company’s financial results, is contained in the Company’s filings with the Securities and Exchange Commission. This presentation includes market and industry data, forecasts and valuations that have been obtained from independent consultant reports, publicly available information, various industry publications and other published industry sources. Although we believe these sources are reliable, we have not independently verified the information and cannot make any representation as to the accuracy or completeness of such information. We disclaim any obligation or undertaking to disseminate any updates or revisions to any forward- looking statements contained in this presentation or to reflect any change in our expectations after the date of this presentation or any change in events, conditions or circumstances on which any statement is based. Use Of Non-GAAP Financial Measures This presentation contains non-GAAP financial measures. These measures, the purposes for which management uses them, why management believes they are useful to investors, and a reconciliation to the most directly comparable GAAP financial measures can be found in the Appendix of this presentation. All references to profit measures and earnings per share on a comparable basis exclude items that affect comparability. PATK LISTED NASDAQ 2

Company Highlights & Overview PATK LISTED NASDAQ
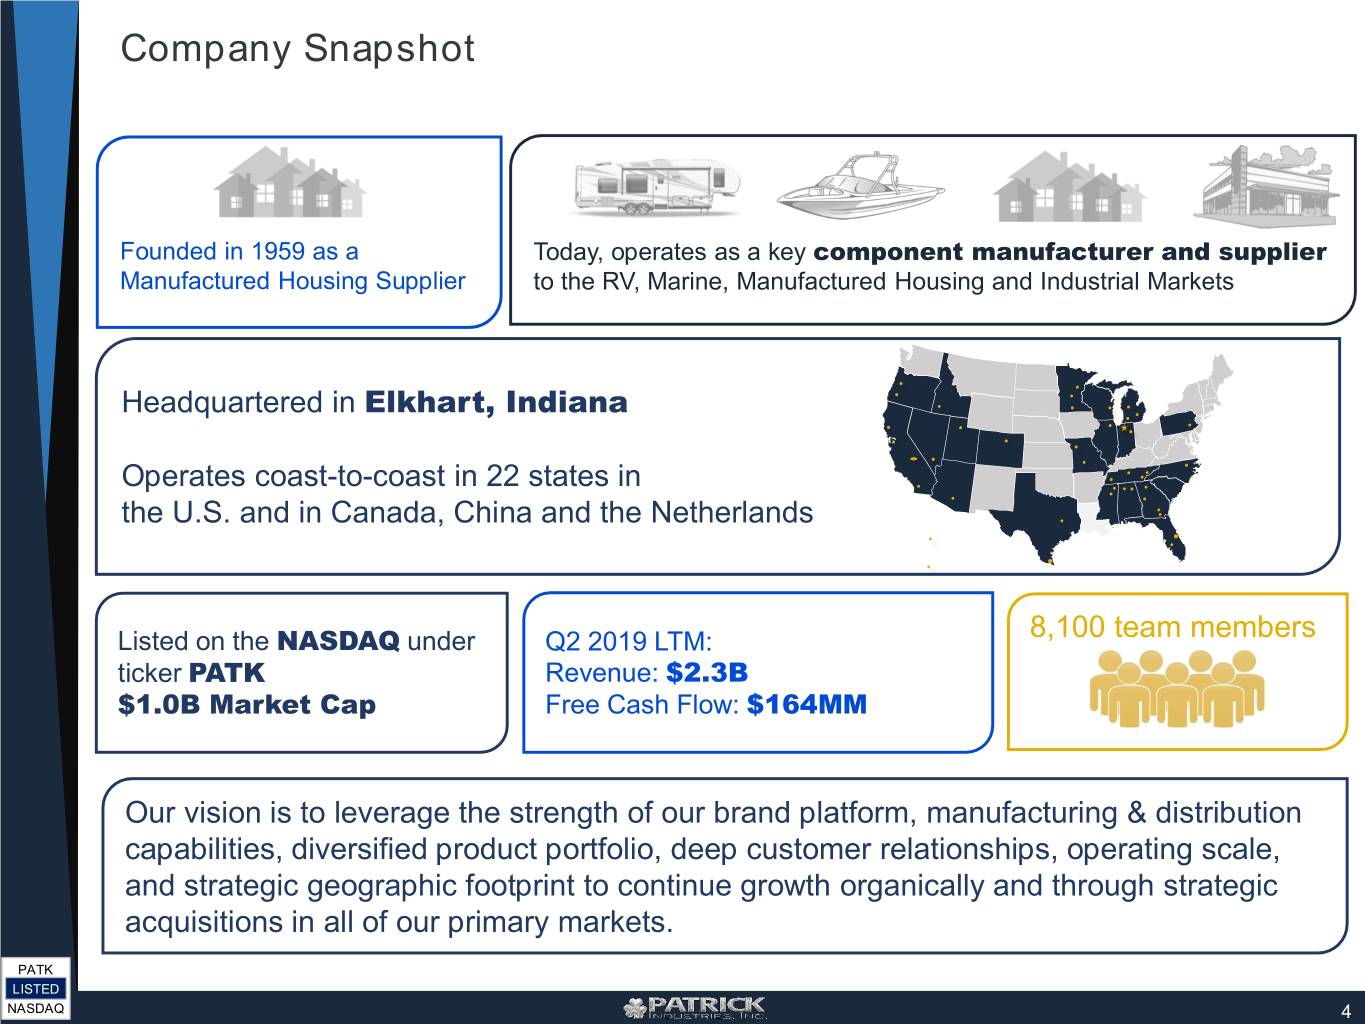
Company Snapshot Founded in 1959 as a Today, operates as a key component manufacturer and supplier Manufactured Housing Supplier to the RV, Marine, Manufactured Housing and Industrial Markets Headquartered in Elkhart, Indiana Operates coast-to-coast in 22 states in the U.S. and in Canada, China and the Netherlands Listed on the NASDAQ under Q2 2019 LTM: 8,100 team members ticker PATK Revenue: $2.3B $1.0B Market Cap Free Cash Flow: $164MM Our vision is to leverage the strength of our brand platform, manufacturing & distribution capabilities, diversified product portfolio, deep customer relationships, operating scale, and strategic geographic footprint to continue growth organically and through strategic acquisitions in all of our primary markets. PATK LISTED NASDAQ 4
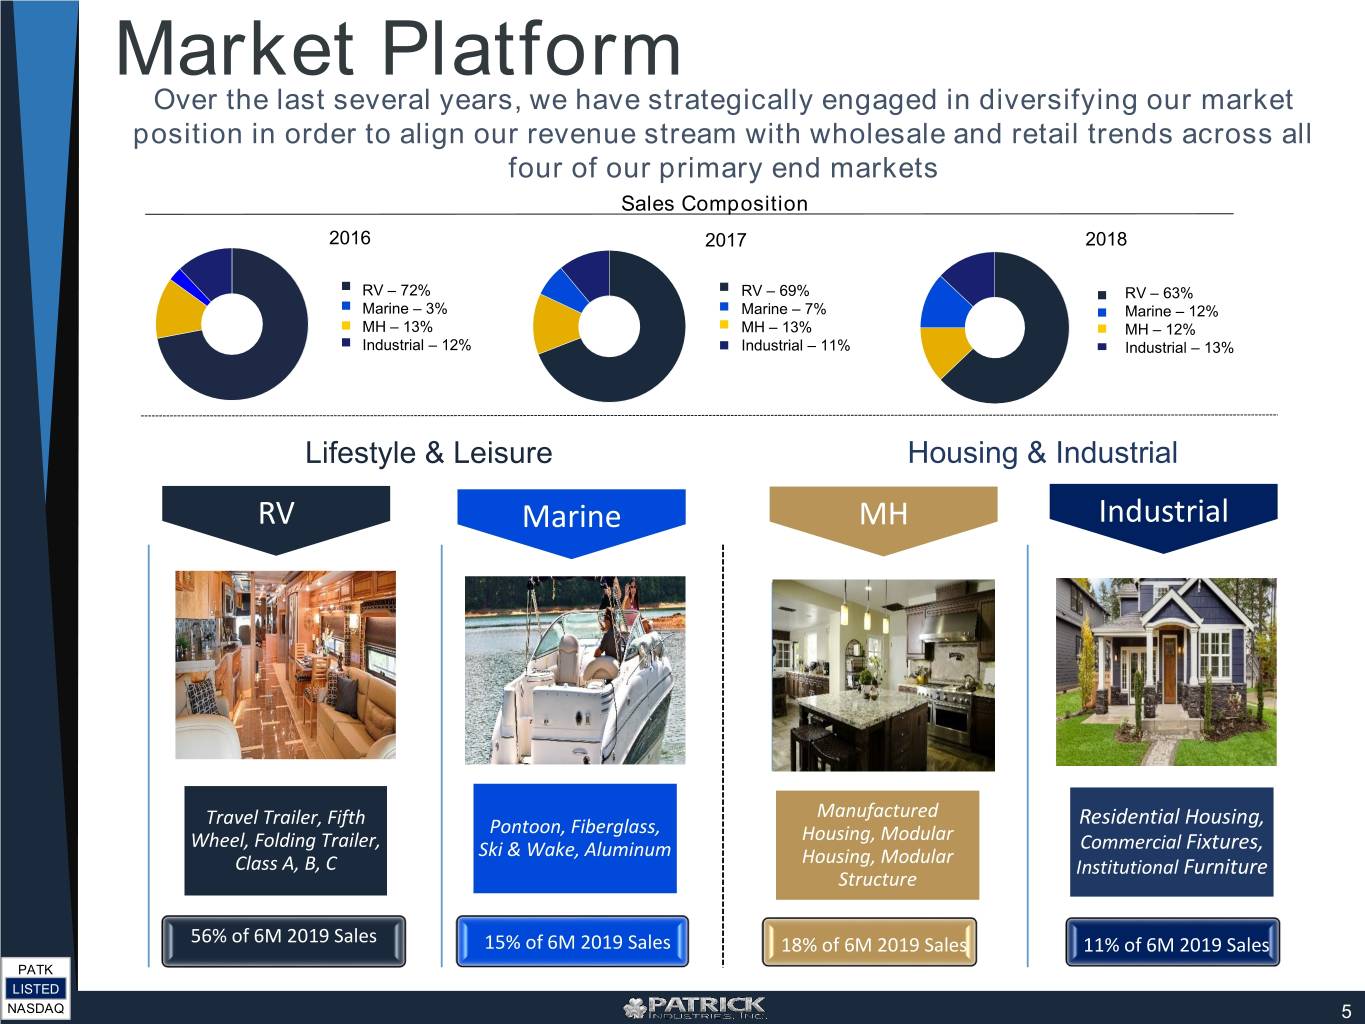
Market Platform Over the last several years, we have strategically engaged in diversifying our market position in order to align our revenue stream with wholesale and retail trends across all four of our primary end markets Sales Composition 2016 2017 2018 RV – 72% RV – 69% RV – 63% Marine – 3% Marine – 7% Marine – 12% MH – 13% MH – 13% MH – 12% Industrial – 12% Industrial – 11% Industrial – 13% Lifestyle & Leisure Housing & Industrial RV Marine MH Industrial Manufactured Travel Trailer, Fifth Pontoon, Fiberglass, Residential Housing, Wheel, Folding Trailer, Housing, Modular Commercial Fixtures, Ski & Wake, Aluminum Housing, Modular Class A, B, C Institutional Furniture Structure 56% of 6M 2019 Sales 15% of 6M 2019 Sales 18% of 6M 2019 Sales 11% of 6M 2019 Sales PATK LISTED NASDAQ 5

Markets Served & Trends PATK LISTED NASDAQ
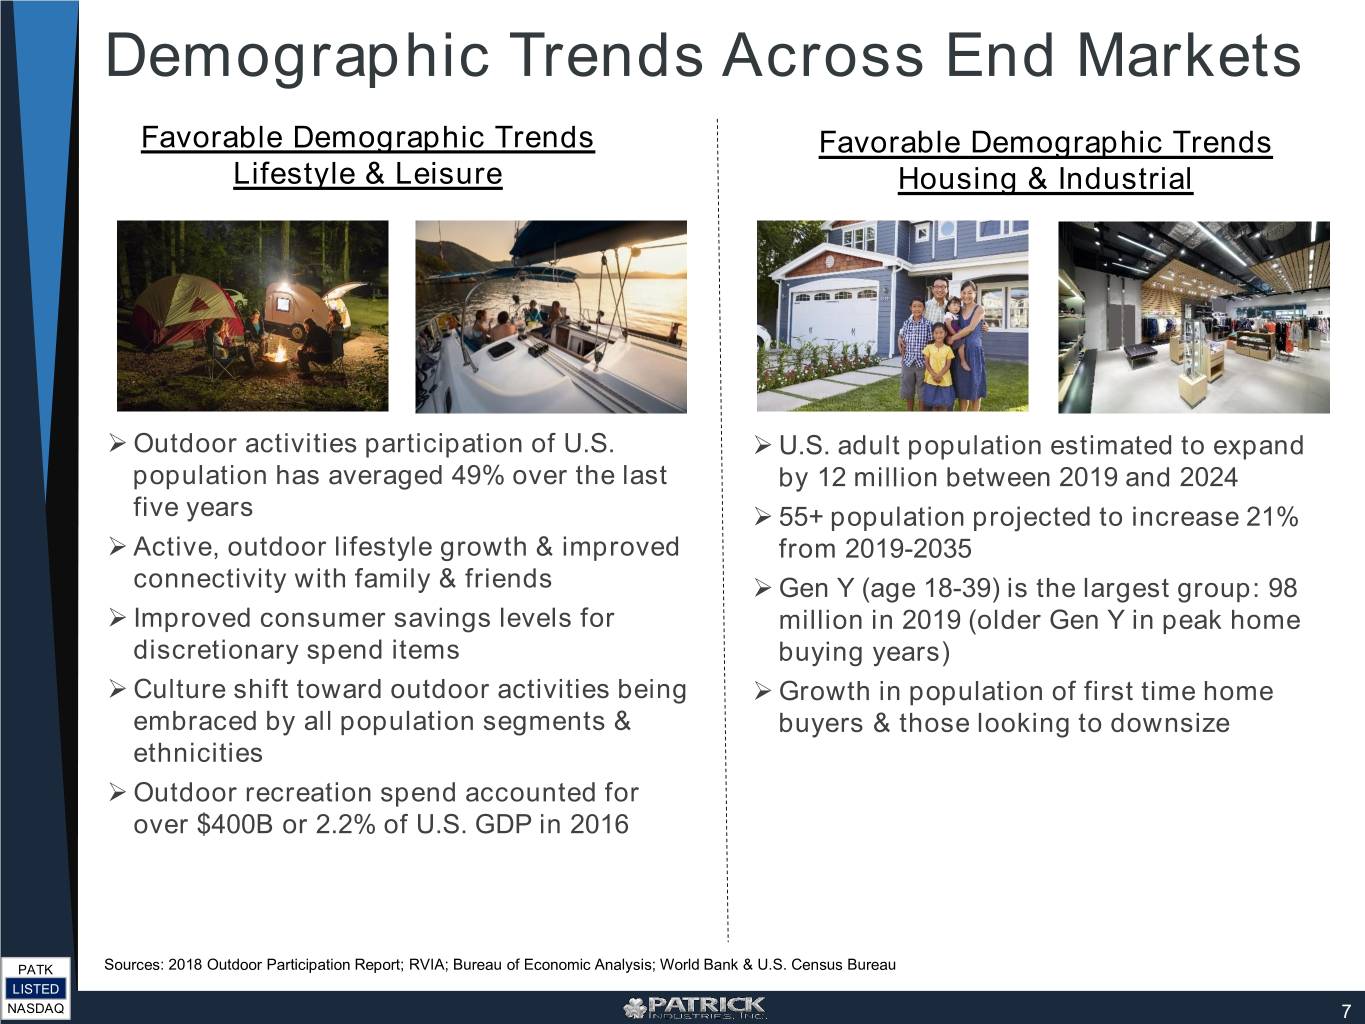
Demographic Trends Across End Markets Favorable Demographic Trends Favorable Demographic Trends Lifestyle & Leisure Housing & Industrial Outdoor activities participation of U.S. U.S. adult population estimated to expand population has averaged 49% over the last by 12 million between 2019 and 2024 five years 55+ population projected to increase 21% Active, outdoor lifestyle growth & improved from 2019-2035 connectivity with family & friends Gen Y (age 18-39) is the largest group: 98 Improved consumer savings levels for million in 2019 (older Gen Y in peak home discretionary spend items buying years) Culture shift toward outdoor activities being Growth in population of first time home embraced by all population segments & buyers & those looking to downsize ethnicities Outdoor recreation spend accounted for over $400B or 2.2% of U.S. GDP in 2016 PATK Sources: 2018 Outdoor Participation Report; RVIA; Bureau of Economic Analysis; World Bank & U.S. Census Bureau LISTED NASDAQ 7
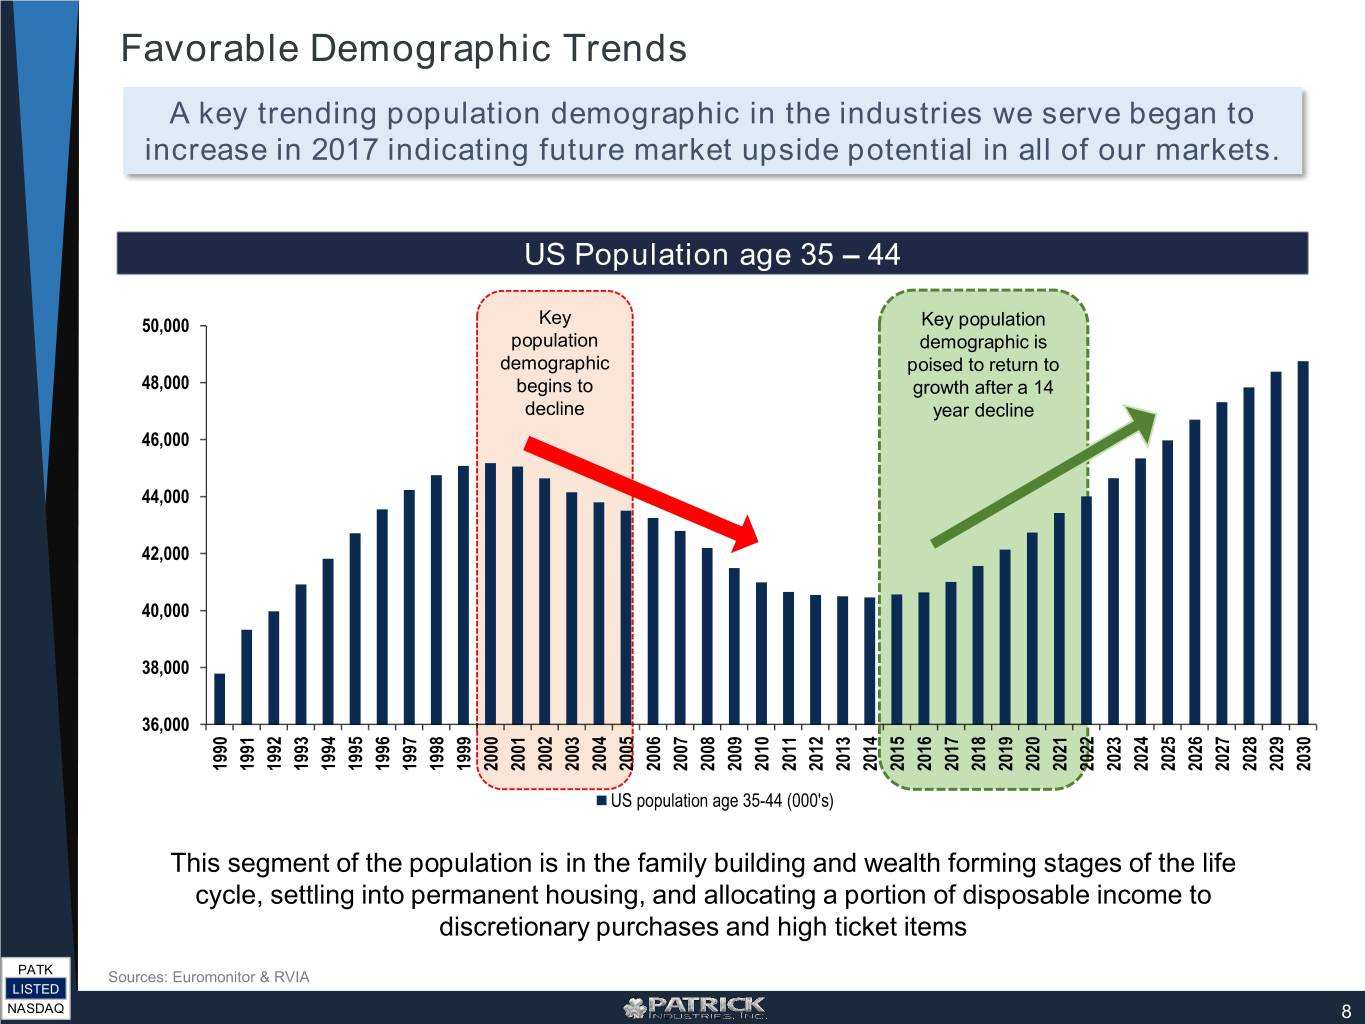
Favorable Demographic Trends A key trending population demographic in the industries we serve began to increase in 2017 indicating future market upside potential in all of our markets. US Population age 35 – 44 50,000 Key Key population population demographic is demographic poised to return to 48,000 begins to growth after a 14 decline year decline 46,000 44,000 42,000 40,000 38,000 36,000 1993 1990 1991 1992 1994 1995 1996 1997 1998 1999 2000 2001 2002 2003 2004 2005 2006 2007 2008 2009 2010 2011 2012 2013 2014 2015 2016 2017 2018 2019 2020 2021 2022 2023 2024 2025 2026 2027 2028 2029 2030 US population age 35-44 (000's) This segment of the population is in the family building and wealth forming stages of the life cycle, settling into permanent housing, and allocating a portion of disposable income to discretionary purchases and high ticket items PATK Sources: Euromonitor & RVIA LISTED NASDAQ 8
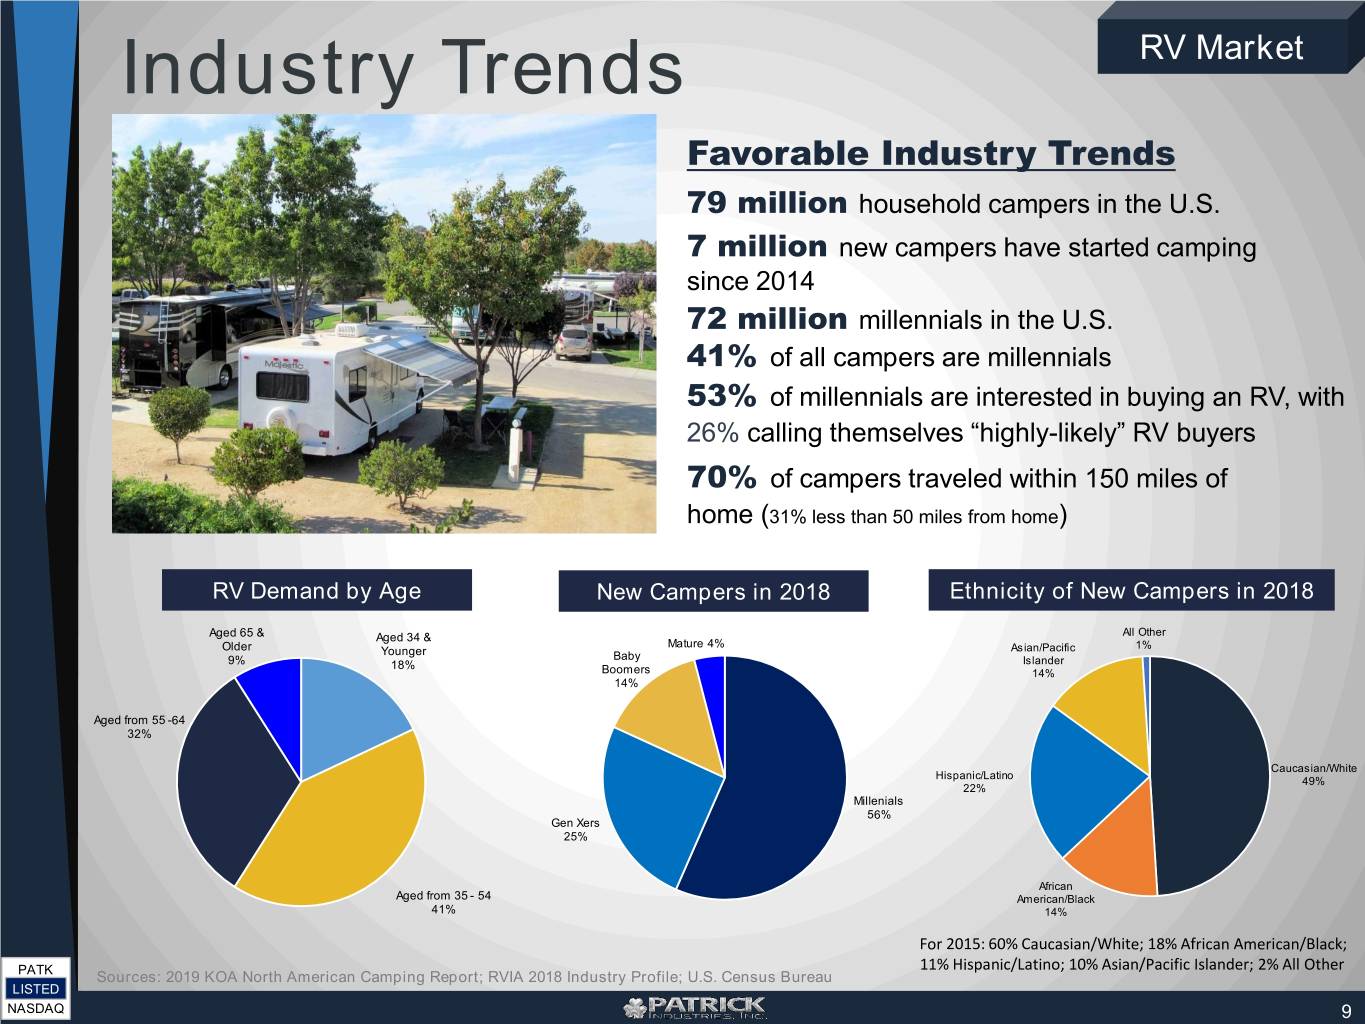
Industry Trends RV Market Favorable Industry Trends 79 million household campers in the U.S. 7 million new campers have started camping since 2014 72 million millennials in the U.S. 41% of all campers are millennials 53% of millennials are interested in buying an RV, with 26% calling themselves “highly-likely” RV buyers 70% of campers traveled within 150 miles of home (31% less than 50 miles from home) RV Demand by Age New Campers in 2018 Ethnicity of New Campers in 2018 Aged 65 & Aged 34 & All Other Older Mature 4% Asian/Pacific 1% Younger Baby 9% 18% Islander Boomers 14% 14% Aged from 55 -64 32% Caucasian/White Hispanic/Latino 49% 22% Millenials 56% Gen Xers 25% African Aged from 35 - 54 American/Black 41% 14% For 2015: 60% Caucasian/White; 18% African American/Black; 11% Hispanic/Latino; 10% Asian/Pacific Islander; 2% All Other PATK Sources: 2019 KOA North American Camping Report; RVIA 2018 Industry Profile; U.S. Census Bureau LISTED NASDAQ 9
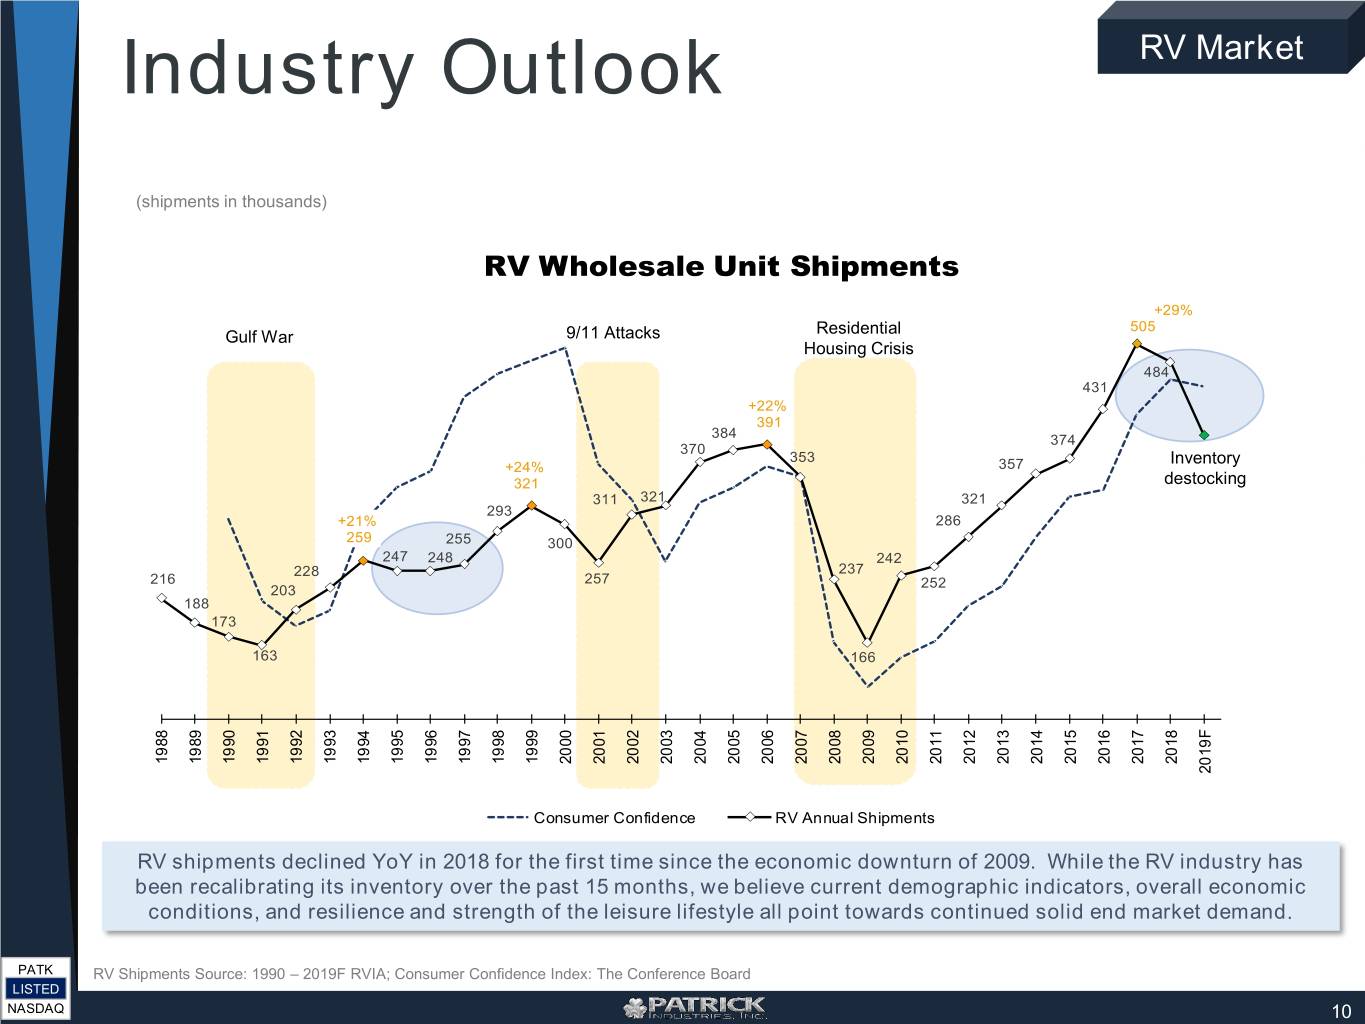
Industry Outlook RV Market (shipments in thousands) RV Wholesale Unit Shipments +29% Residential 505 Gulf War 9/11 Attacks Housing Crisis 484 431 +22% 391 384 374 370 353 Inventory +24% 357 321 destocking 311 321 321 293 +21% 286 259 255 300 247 248 242 228 237 216 257 252 203 188 173 163 166 2018 2017 2016 2015 2014 2013 2012 2011 2010 2009 2008 2007 2006 2005 2004 2003 2002 2001 2000 1999 1998 1997 1996 1995 1994 1993 1992 1991 1990 1989 1988 2019F Consumer Confidence RV Annual Shipments RV shipments declined YoY in 2018 for the first time since the economic downturn of 2009. While the RV industry has been recalibrating its inventory over the past 15 months, we believe current demographic indicators, overall economic conditions, and resilience and strength of the leisure lifestyle all point towards continued solid end market demand. PATK RV Shipments Source: 1990 – 2019F RVIA; Consumer Confidence Index: The Conference Board LISTED NASDAQ 10
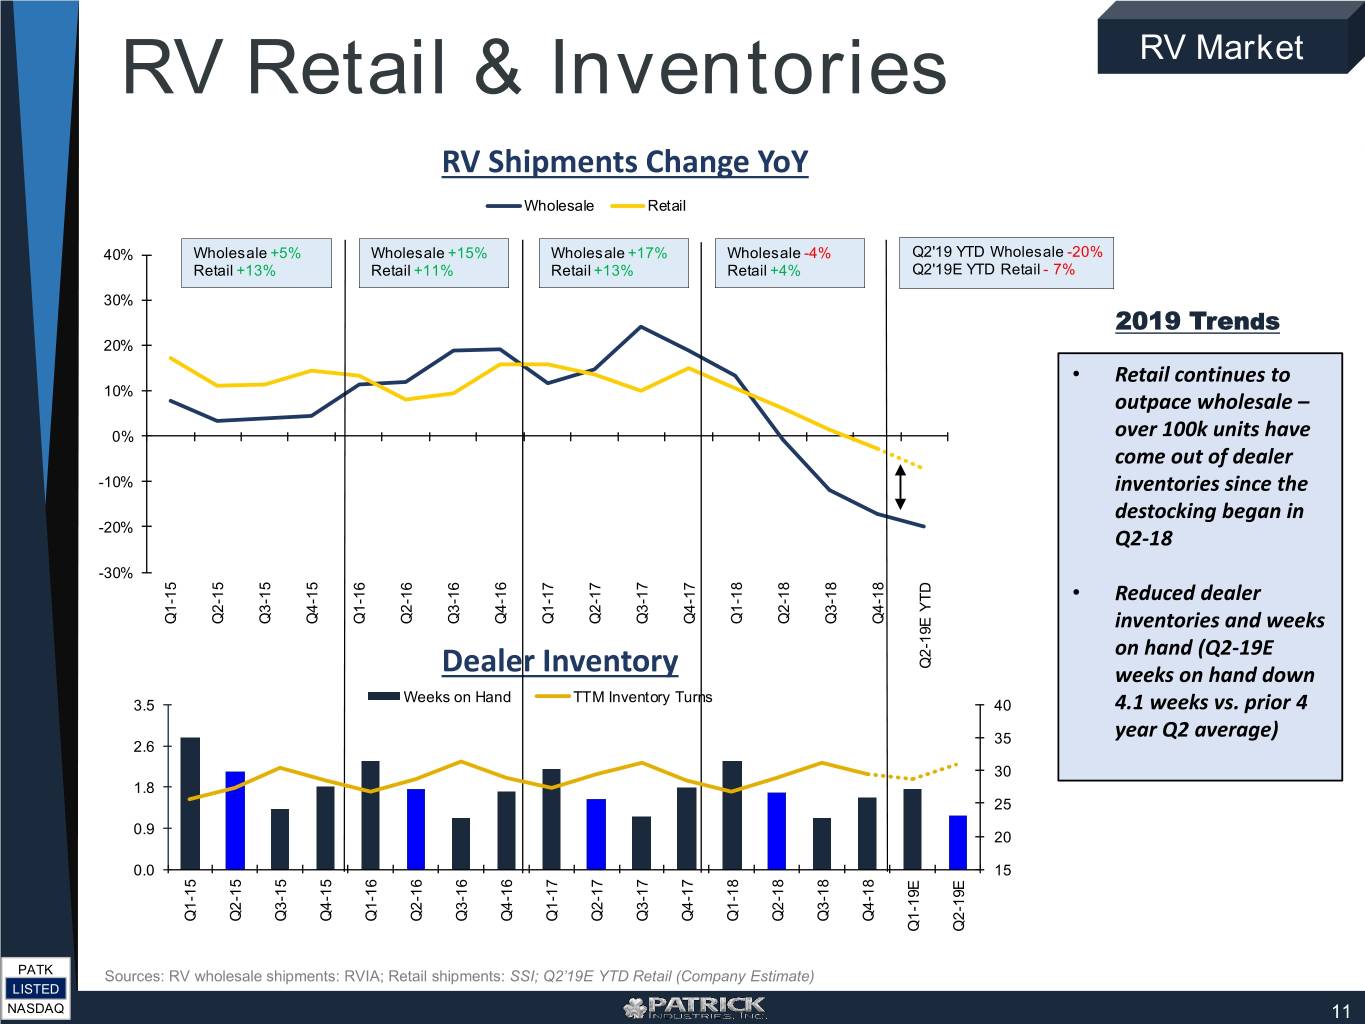
RV Retail & Inventories RV Market RV Shipments Change YoY Wholesale Retail 40% Wholesale +5% Wholesale +15% Wholesale +17% Wholesale -4% Q2'19 YTD Wholesale -20% Retail +13% Retail +11% Retail +13% Retail +4% Q2'19E YTD Retail - 7% 30% 2019 Trends 20% • Retail continues to 10% outpace wholesale – 0% over 100k units have come out of dealer -10% inventories since the destocking began in -20% Q2-18 -30% • Reduced dealer Q1-15 Q2-15 Q3-15 Q4-15 Q1-16 Q2-16 Q3-16 Q4-16 Q1-17 Q2-17 Q3-17 Q4-17 Q1-18 Q2-18 Q3-18 Q4-18 inventories and weeks on hand (Q2-19E Dealer Inventory Q2-19E YTD weeks on hand down Weeks on Hand TTM Inventory Turns 3.5 40 4.1 weeks vs. prior 4 35 year Q2 average) 2.6 30 1.8 25 0.9 20 0.0 15 Q1-15 Q2-15 Q3-15 Q4-15 Q1-16 Q2-16 Q3-16 Q4-16 Q1-17 Q2-17 Q3-17 Q4-17 Q1-18 Q2-18 Q3-18 Q4-18 Q1-19E Q2-19E PATK Sources: RV wholesale shipments: RVIA; Retail shipments: SSI; Q2’19E YTD Retail (Company Estimate) LISTED NASDAQ 11
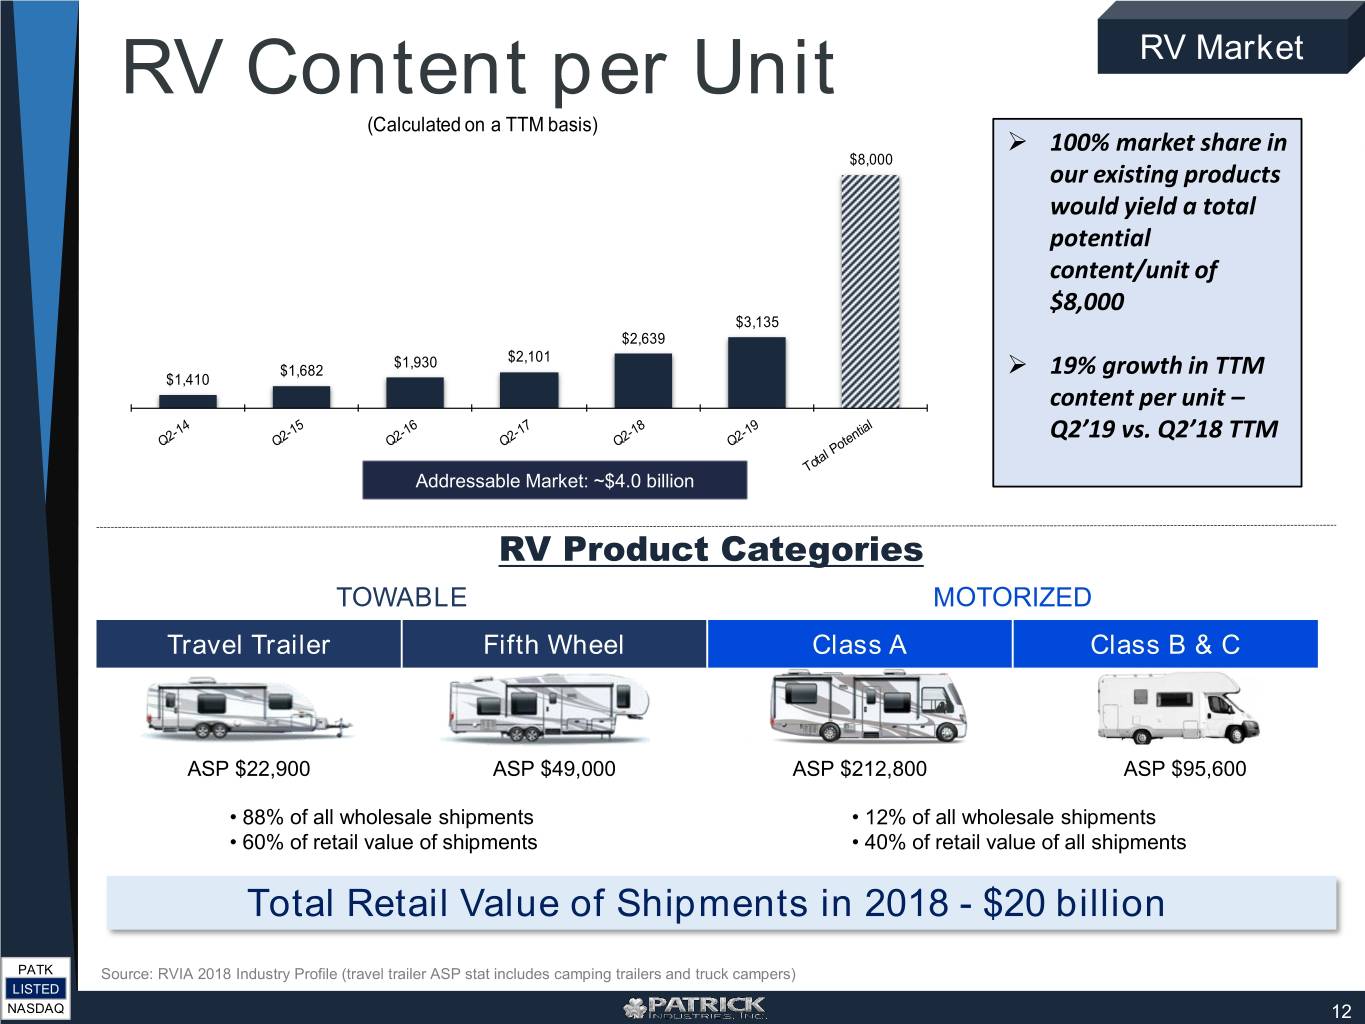
RV Content per Unit RV Market Folding Camper (Calculated on a TTM basis) 100%Truck Campermarket share in $8,000 our existing products wouldMotorized: yield a total Type B potentialType C content/unit Total B & C of $8,000 $3,135 ASP -2017 $2,639 Towables: $1,930 $2,101 $1,682 19% growth in TTM $1,410 Travel Trailer contentFolding Camper per unit – Truck Camper Q2’19 vs. Q2’18 TTM Addressable Market: ~$4.0 billion RV Product Categories TOWABLE MOTORIZED Travel Trailer Fifth Wheel Class A Class B & C ASP $22,900 ASP $49,000 ASP $212,800 ASP $95,600 • 88% of all wholesale shipments • 12% of all wholesale shipments • 60% of retail value of shipments • 40% of retail value of all shipments Total Retail Value of Shipments in 2018 - $20 billion PATK Source: RVIA 2018 Industry Profile (travel trailer ASP stat includes camping trailers and truck campers) LISTED NASDAQ 12
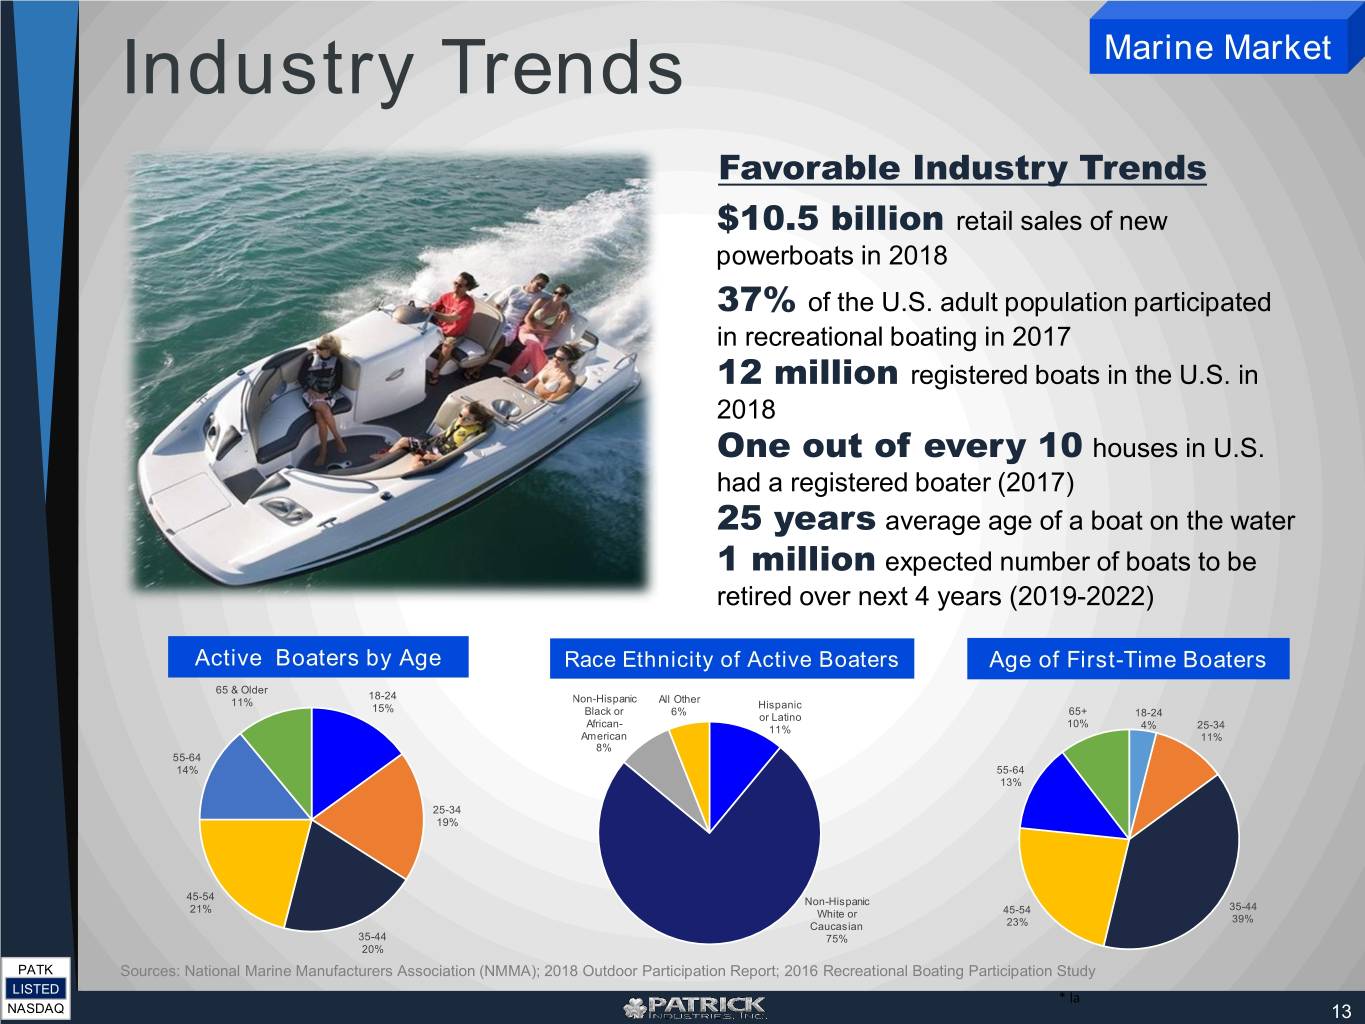
Industry Trends Marine Market Favorable Industry Trends $10.5 billion retail sales of new powerboats in 2018 37% of the U.S. adult population participated in recreational boating in 2017 12 million registered boats in the U.S. in 2018 One out of every 10 houses in U.S. had a registered boater (2017) 25 years average age of a boat on the water 1 million expected number of boats to be retired over next 4 years (2019-2022) Active Boaters by Age Race Ethnicity of Active Boaters Age of First-Time Boaters 65 & Older 18-24 Non-Hispanic All Other 11% Hispanic 15% Black or 6% 65+ or Latino 18-24 African- 10% 11% 4% 25-34 American 11% 8% 55-64 14% 55-64 13% 25-34 19% 45-54 Non-Hispanic 21% 45-54 35-44 White or 39% Caucasian 23% 35-44 75% 20% PATK Sources: National Marine Manufacturers Association (NMMA); 2018 Outdoor Participation Report; 2016 Recreational Boating Participation Study LISTED * la NASDAQ 13
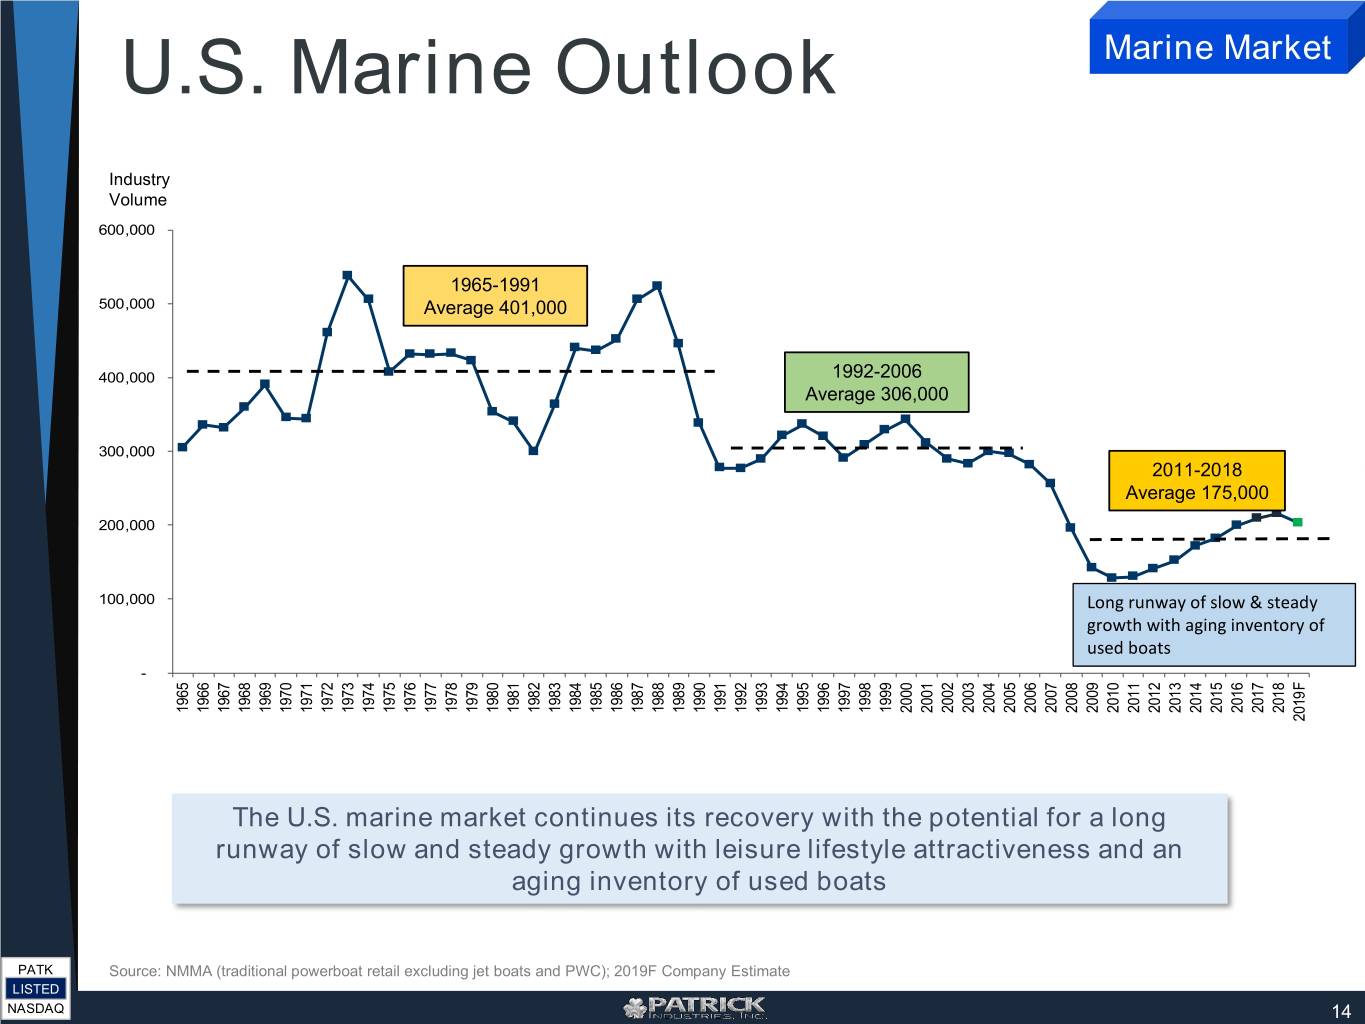
U.S. Marine Outlook Marine Market Industry Volume 600,000 1965-1991 500,000 Average 401,000 400,000 1992-2006 Average 306,000 300,000 2011-2018 Average 175,000 200,000 100,000 Long runway of slow & steady growth with aging inventory of used boats - 1965 1966 1967 1968 1969 1970 1971 1972 1973 1974 1975 1976 1977 1978 1979 1980 1981 1982 1983 1984 1985 1986 1987 1988 1989 1990 1991 1992 1993 1994 1995 1996 1997 1998 1999 2000 2001 2002 2003 2004 2005 2006 2007 2008 2009 2010 2011 2012 2013 2014 2015 2016 2017 2018 2019F The U.S. marine market continues its recovery with the potential for a long runway of slow and steady growth with leisure lifestyle attractiveness and an aging inventory of used boats PATK Source: NMMA (traditional powerboat retail excluding jet boats and PWC); 2019F Company Estimate LISTED NASDAQ 14
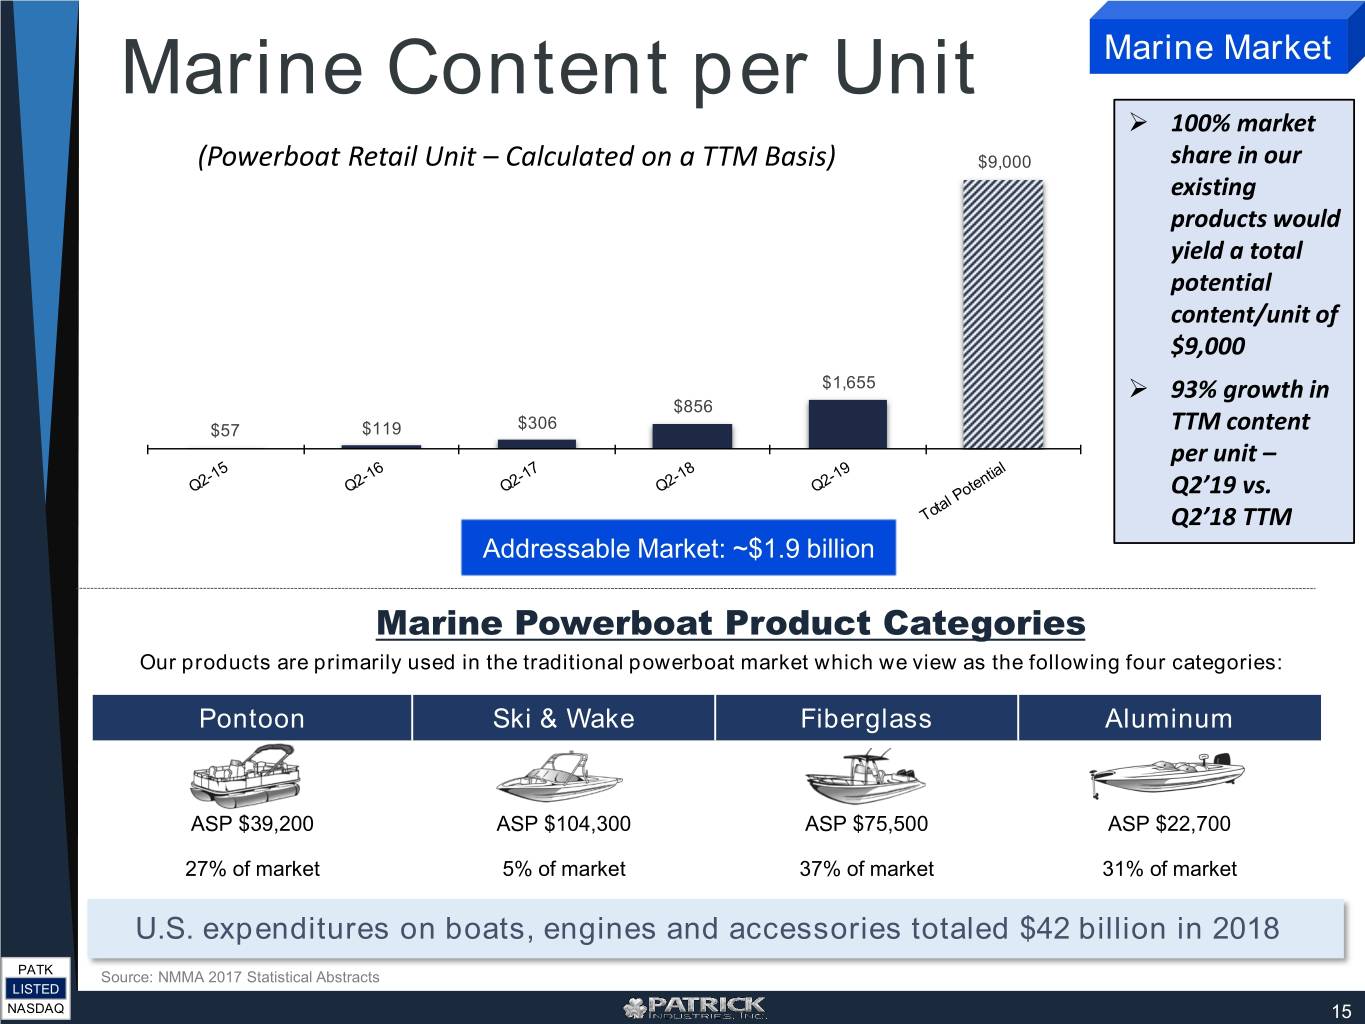
Marine Content per Unit Marine Market 100% market (Powerboat Retail Unit – Calculated on a TTM Basis) $9,000 share in our existing products would yield a total potential content/unit of $9,000 $1,655 93% growth in $856 $57 $119 $306 TTM content per unit – Q2’19 vs. Q2’18 TTM Addressable Market: ~$1.9 billion Marine Powerboat Product Categories Our products are primarily used in the traditional powerboat market which we view as the following four categories: Pontoon Ski & Wake Fiberglass Aluminum ASP $39,200 ASP $104,300 ASP $75,500 ASP $22,700 27% of market 5% of market 37% of market 31% of market U.S. expenditures on boats, engines and accessories totaled $42 billion in 2018 PATK Source: NMMA 2017 Statistical Abstracts LISTED NASDAQ 15
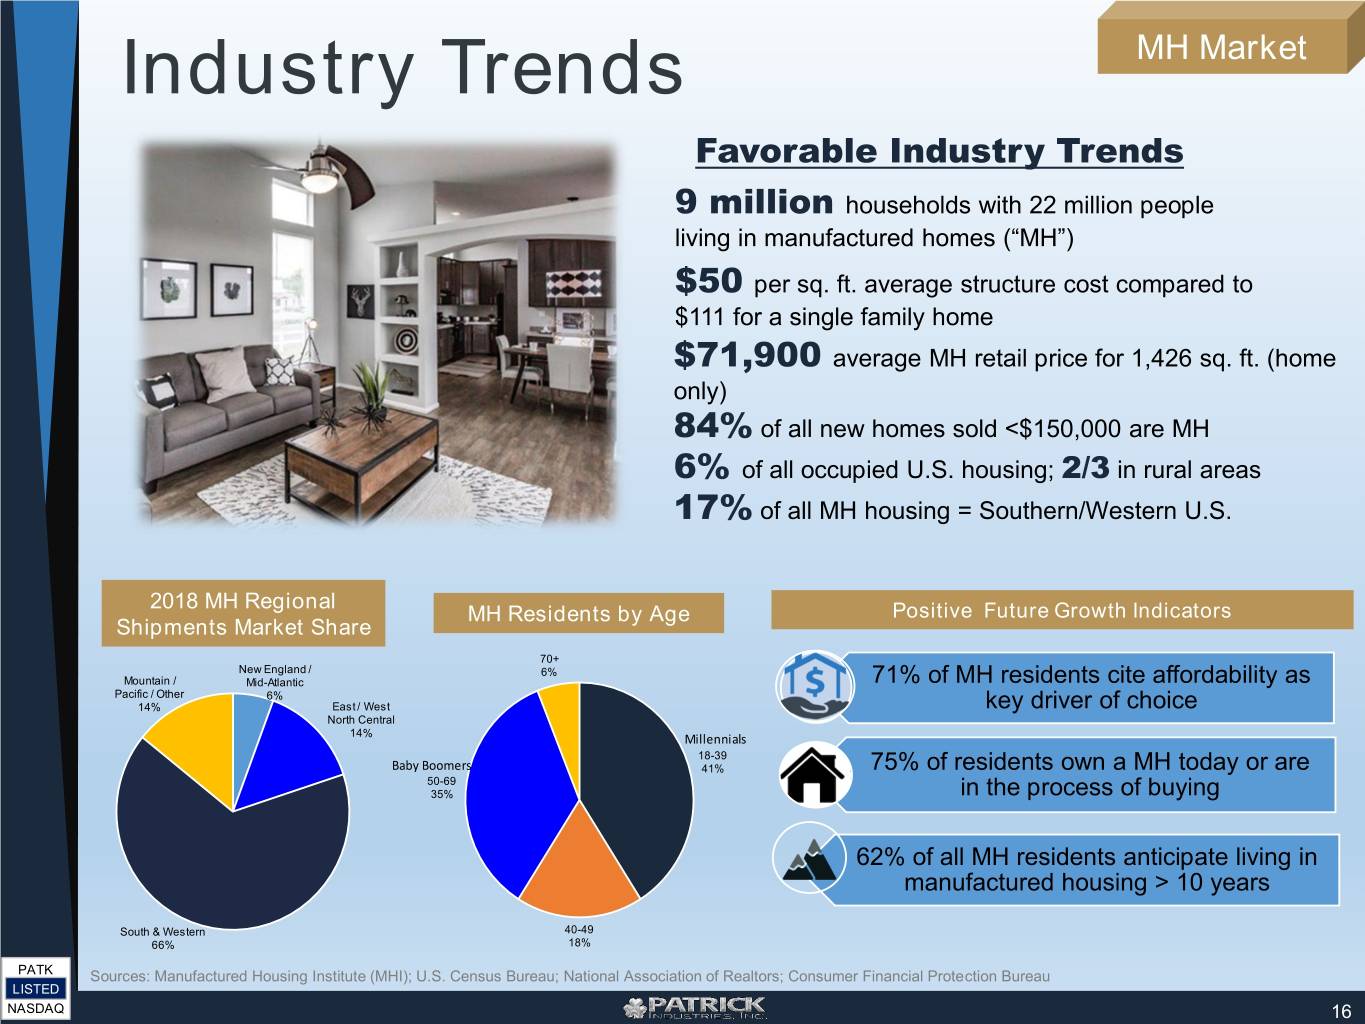
Industry Trends MH Market Favorable Industry Trends 9 million households with 22 million people living in manufactured homes (“MH”) $50 per sq. ft. average structure cost compared to $111 for a single family home $71,900 average MH retail price for 1,426 sq. ft. (home only) 84% of all new homes sold <$150,000 are MH 6% of all occupied U.S. housing; 2/3 in rural areas 17% of all MH housing = Southern/Western U.S. 2018 MH Regional MH Residents by Age Positive Future Growth Indicators Shipments Market Share 70+ New England / 6% Mountain / Mid-Atlantic 71% of MH residents cite affordability as Pacific / Other 6% 14% East / West key driver of choice North Central 14% Millennials 18-39 Baby Boomers 41% 75% of residents own a MH today or are 50-69 35% in the process of buying 62% of all MH residents anticipate living in manufactured housing > 10 years South & Western 40-49 66% 18% PATK Sources: Manufactured Housing Institute (MHI); U.S. Census Bureau; National Association of Realtors; Consumer Financial Protection Bureau LISTED NASDAQ 16
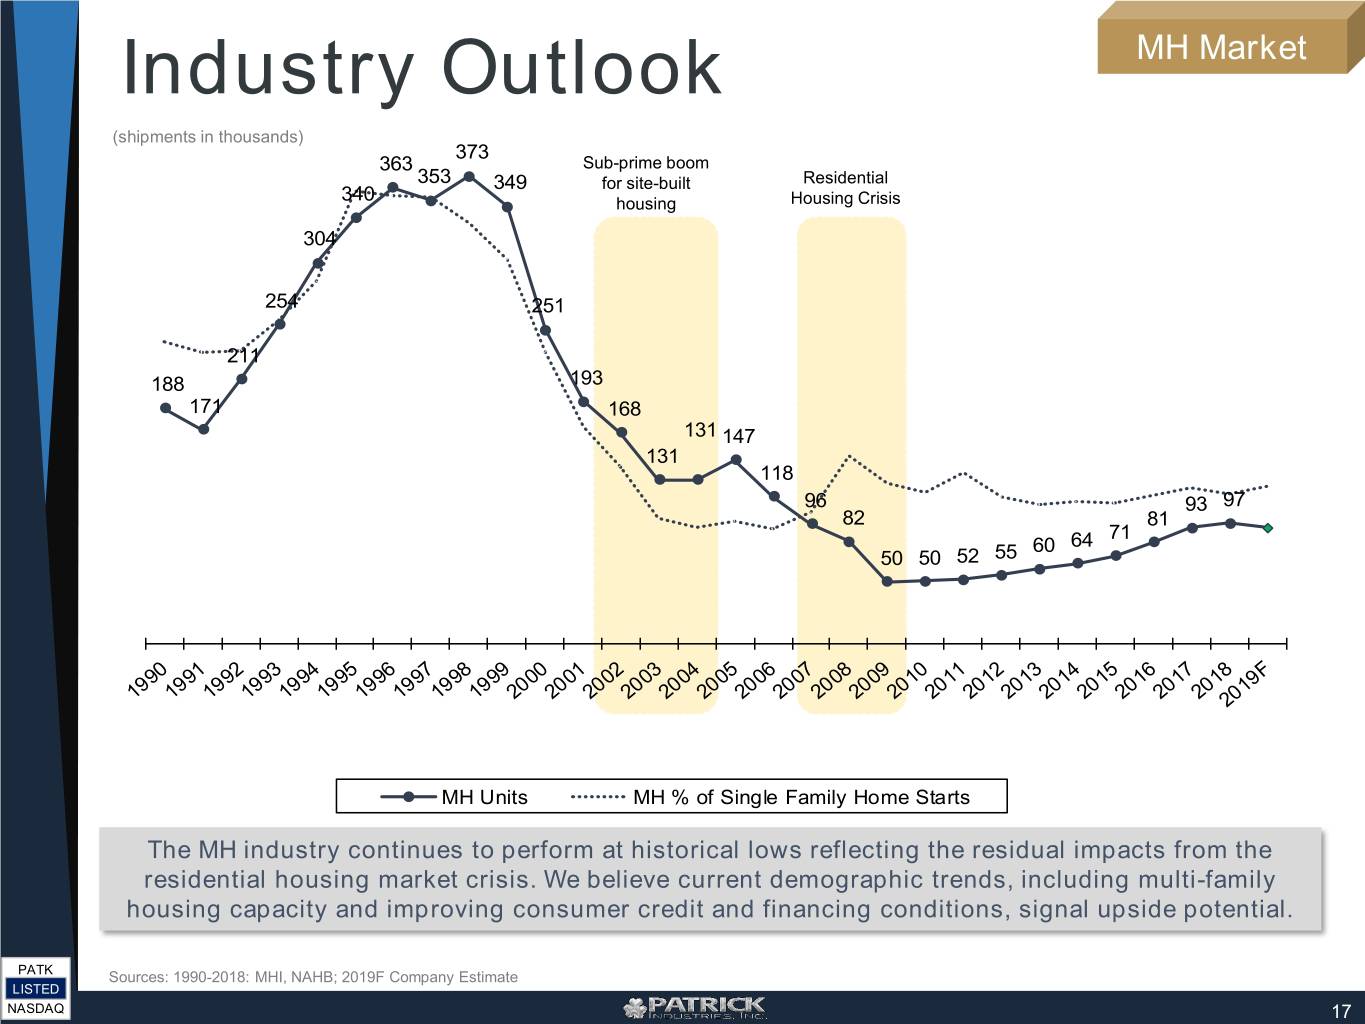
Industry Outlook MH Market (shipments in thousands) 373 363 Sub-prime boom 353 349 for site-built Residential 340 housing Housing Crisis 304 254 251 211 188 193 171 168 131 147 131 118 96 93 97 82 81 71 60 64 50 50 52 55 MH Units MH % of Single Family Home Starts The MH industry continues to perform at historical lows reflecting the residual impacts from the residential housing market crisis. We believe current demographic trends, including multi-family housing capacity and improving consumer credit and financing conditions, signal upside potential. PATK Sources: 1990-2018: MHI, NAHB; 2019F Company Estimate LISTED NASDAQ 17
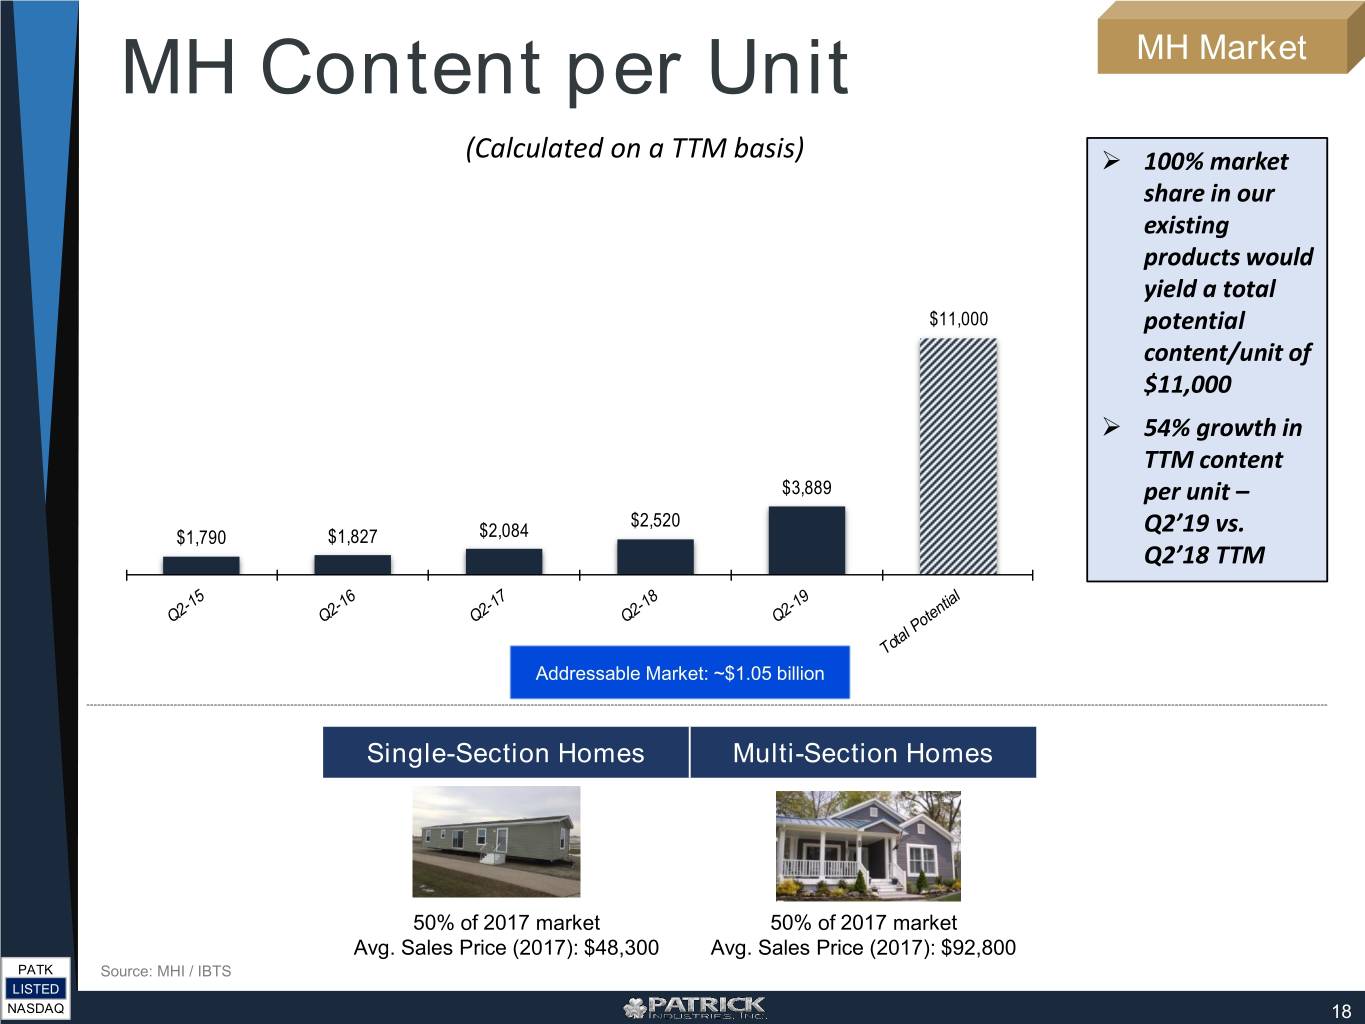
MH Content per Unit MH Market (Calculated on a TTM basis) 100% market share in our existing products would yield a total $11,000 potential content/unit of $11,000 54% growth in TTM content $3,889 per unit – $2,520 Q2’19 vs. $1,790 $1,827 $2,084 Q2’18 TTM Addressable Market: ~$1.05 billion Single-Section Homes Multi-Section Homes 50% of 2017 market 50% of 2017 market Avg. Sales Price (2017): $48,300 Avg. Sales Price (2017): $92,800 PATK Source: MHI / IBTS LISTED NASDAQ 18
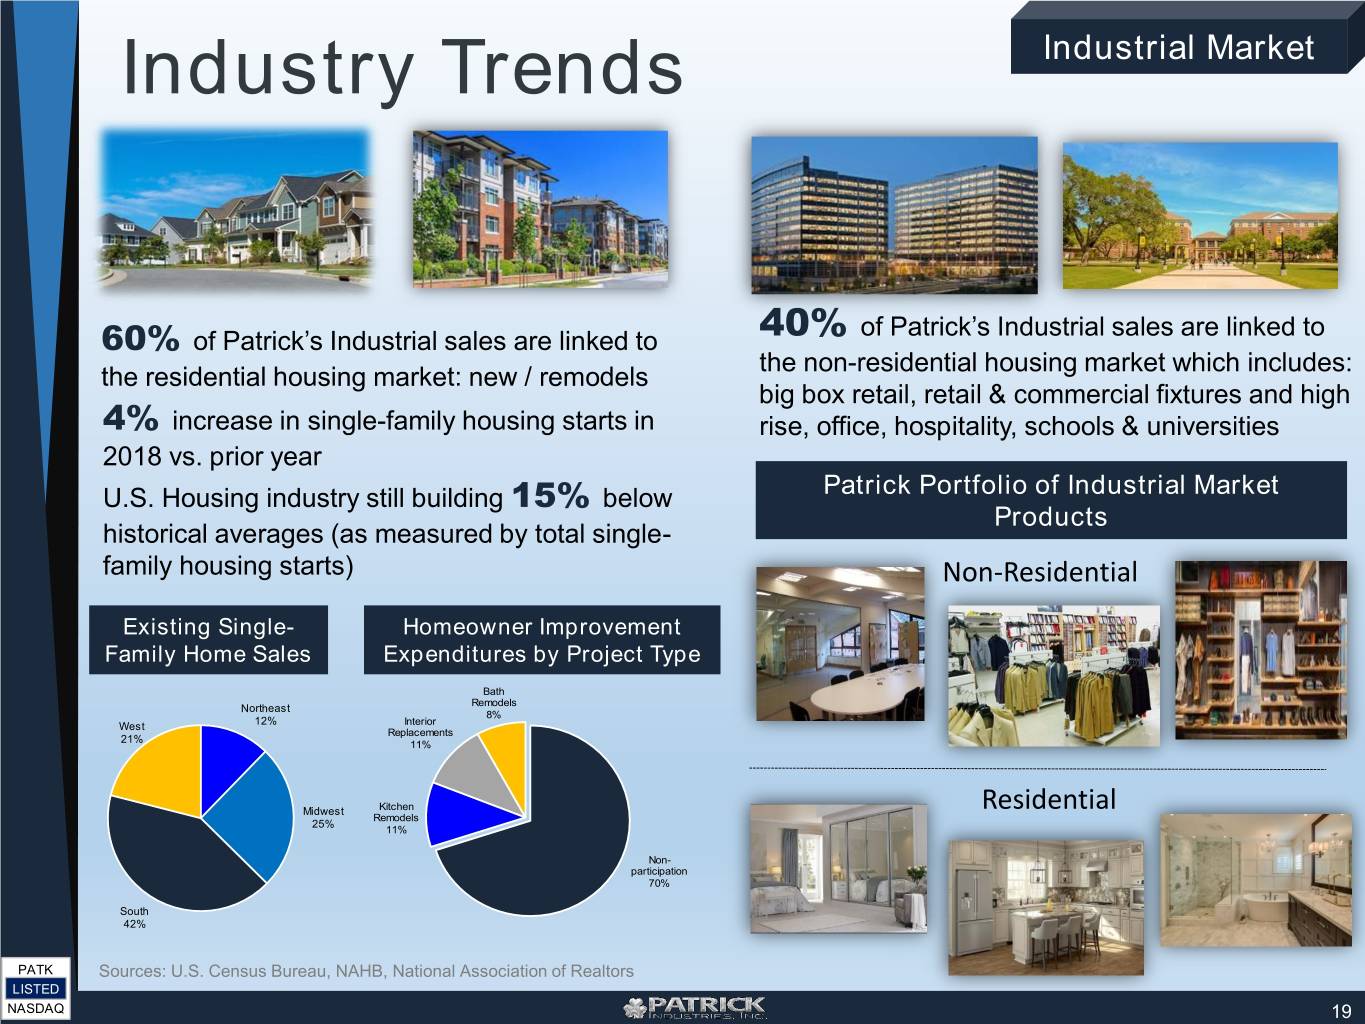
Industry Trends Industrial Market of Patrick’s Industrial sales are linked to 60% of Patrick’s Industrial sales are linked to 40% the non-residential housing market which includes: the residential housing market: new / remodels big box retail, retail & commercial fixtures and high 4% increase in single-family housing starts in rise, office, hospitality, schools & universities 2018 vs. prior year U.S. Housing industry still building 15% below Patrick Portfolio of Industrial Market Products historical averages (as measured by total single- family housing starts) Non-Residential Existing Single- Homeowner Improvement Family Home Sales Expenditures by Project Type Bath Remodels Northeast 8% West 12% Interior Replacements 21% 11% Midwest Kitchen Residential Remodels 25% 11% Non- participation 70% South 42% PATK Sources: U.S. Census Bureau, NAHB, National Association of Realtors LISTED NASDAQ 19
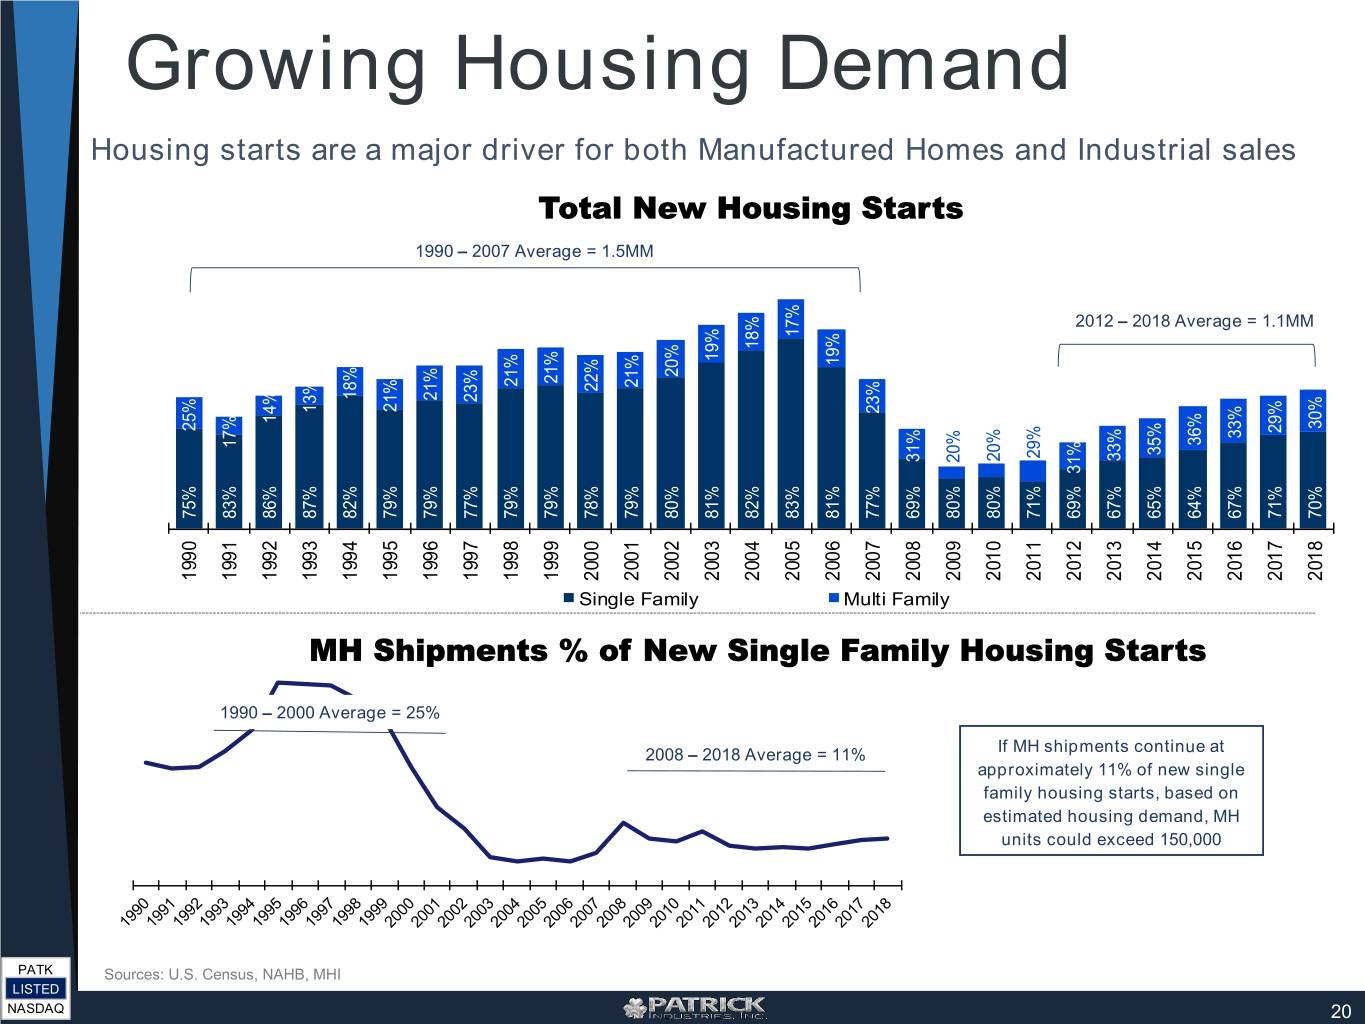
Growing Housing Demand Housing starts are a major driver for both Manufactured Homes and Industrial sales Total New Housing Starts 1990 – 2007 Average = 1.5MM 2012 – 2018 Average = 1.1MM 17% 18% 19% 19% 20% 21% 21% 21% 22% 18% 21% 23% 21% 13% 23% 14% 30% 25% 29% 33% 36% 17% 35% 29% 33% 20% 31% 20% 31% 75% 83% 86% 87% 82% 79% 79% 77% 79% 79% 78% 79% 80% 81% 82% 83% 81% 77% 69% 80% 80% 71% 69% 67% 65% 64% 67% 71% 70% 1990 1991 1992 1993 1994 1995 1996 1997 1998 1999 2000 2001 2002 2003 2004 2005 2006 2007 2008 2009 2010 2011 2012 2013 2014 2015 2016 2017 2018 Single Family Multi Family MH Shipments % of New Single Family Housing Starts 1990 – 2000 Average = 25% If MH shipments continue at 2008 – 2018 Average = 11% approximately 11% of new single family housing starts, based on estimated housing demand, MH units could exceed 150,000 PATK Sources: U.S. Census, NAHB, MHI LISTED NASDAQ 20

Growth Initiatives & Capital Allocation Strategy PATK LISTED NASDAQ
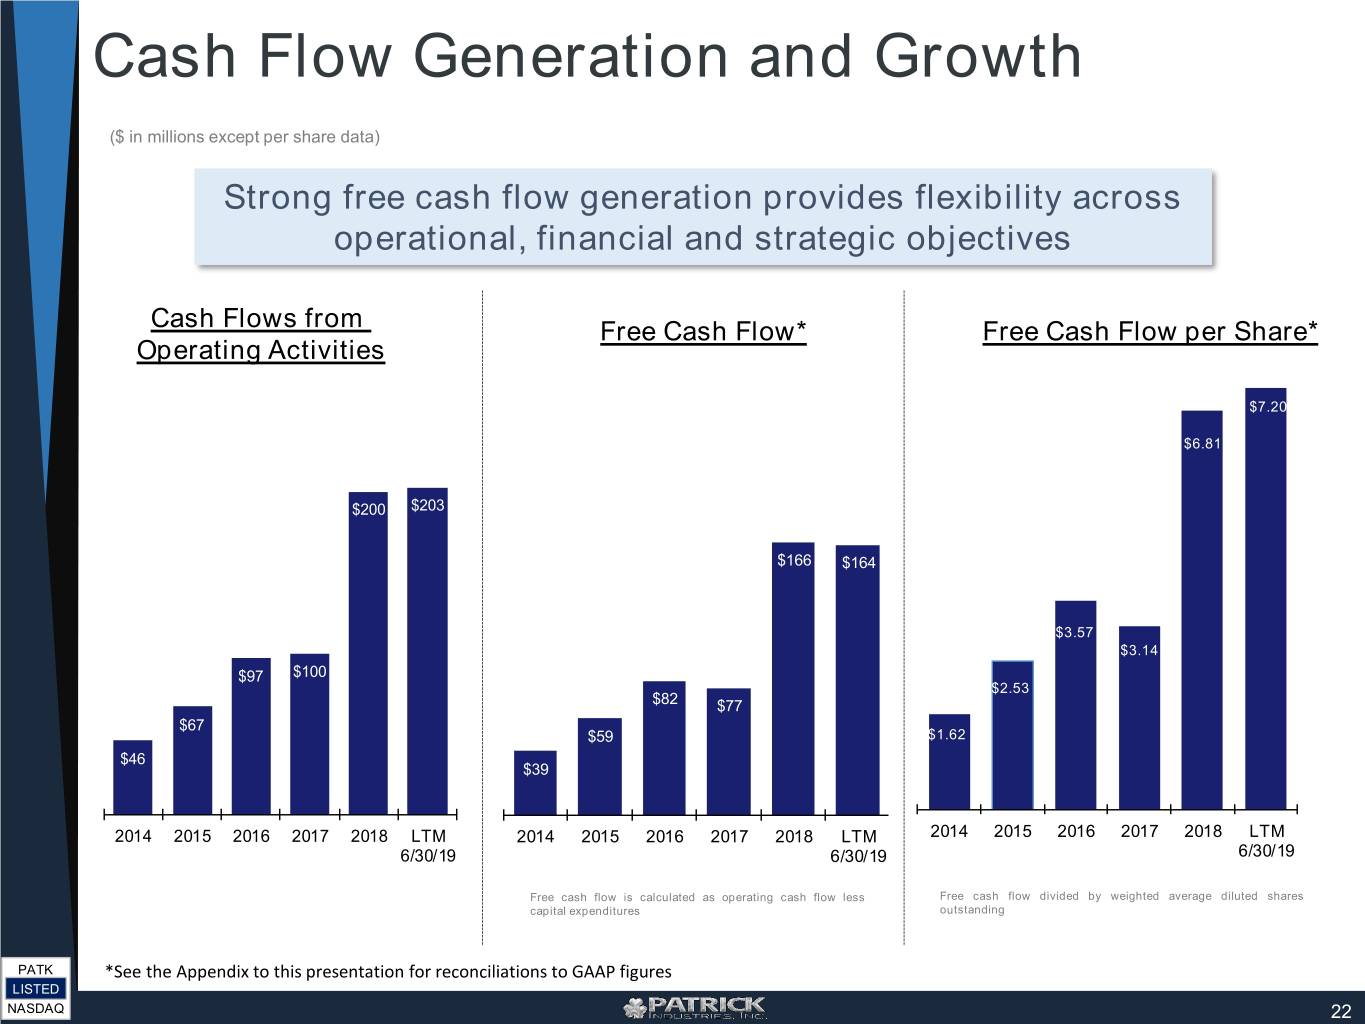
Cash Flow Generation and Growth ($ in millions except per share data) Strong free cash flow generation provides flexibility across operational, financial and strategic objectives Cash Flows from Free Cash Flow* Free Cash Flow per Share* Operating Activities $7.20 $6.81 $200 $203 $166 $164 $3.57 $3.14 $97 $100 $2.53 $82 $77 $67 $59 $1.62 $46 $39 2014 2015 2016 2017 2018 LTM 2014 2015 2016 2017 2018 LTM 2014 2015 2016 2017 2018 LTM 6/30/19 6/30/19 6/30/19 Free cash flow is calculated as operating cash flow less Free cash flow divided by weighted average diluted shares capital expenditures outstanding PATK *See the Appendix to this presentation for reconciliations to GAAP figures LISTED NASDAQ 22
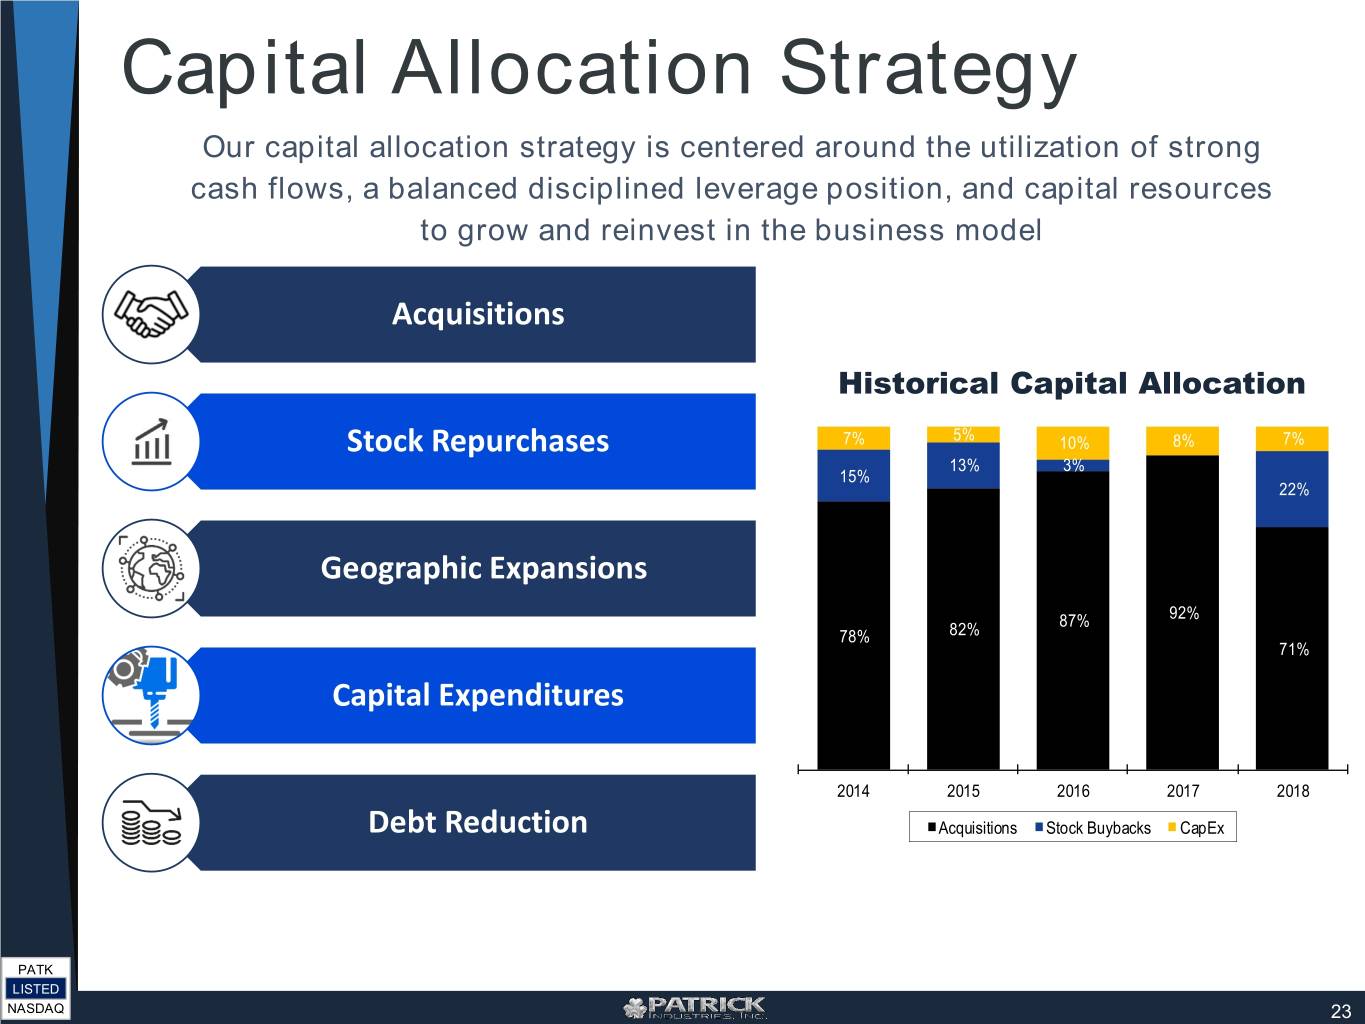
Capital Allocation Strategy Our capital allocation strategy is centered around the utilization of strong cash flows, a balanced disciplined leverage position, and capital resources to grow and reinvest in the business model Acquisitions Historical Capital Allocation Stock Repurchases 7% 5% 10% 8% 7% 13% 3% 15% 22% Geographic Expansions 87% 92% 78% 82% 71% Capital Expenditures 2014 2015 2016 2017 2018 Debt Reduction Acquisitions Stock Buybacks CapEx PATK LISTED NASDAQ 23
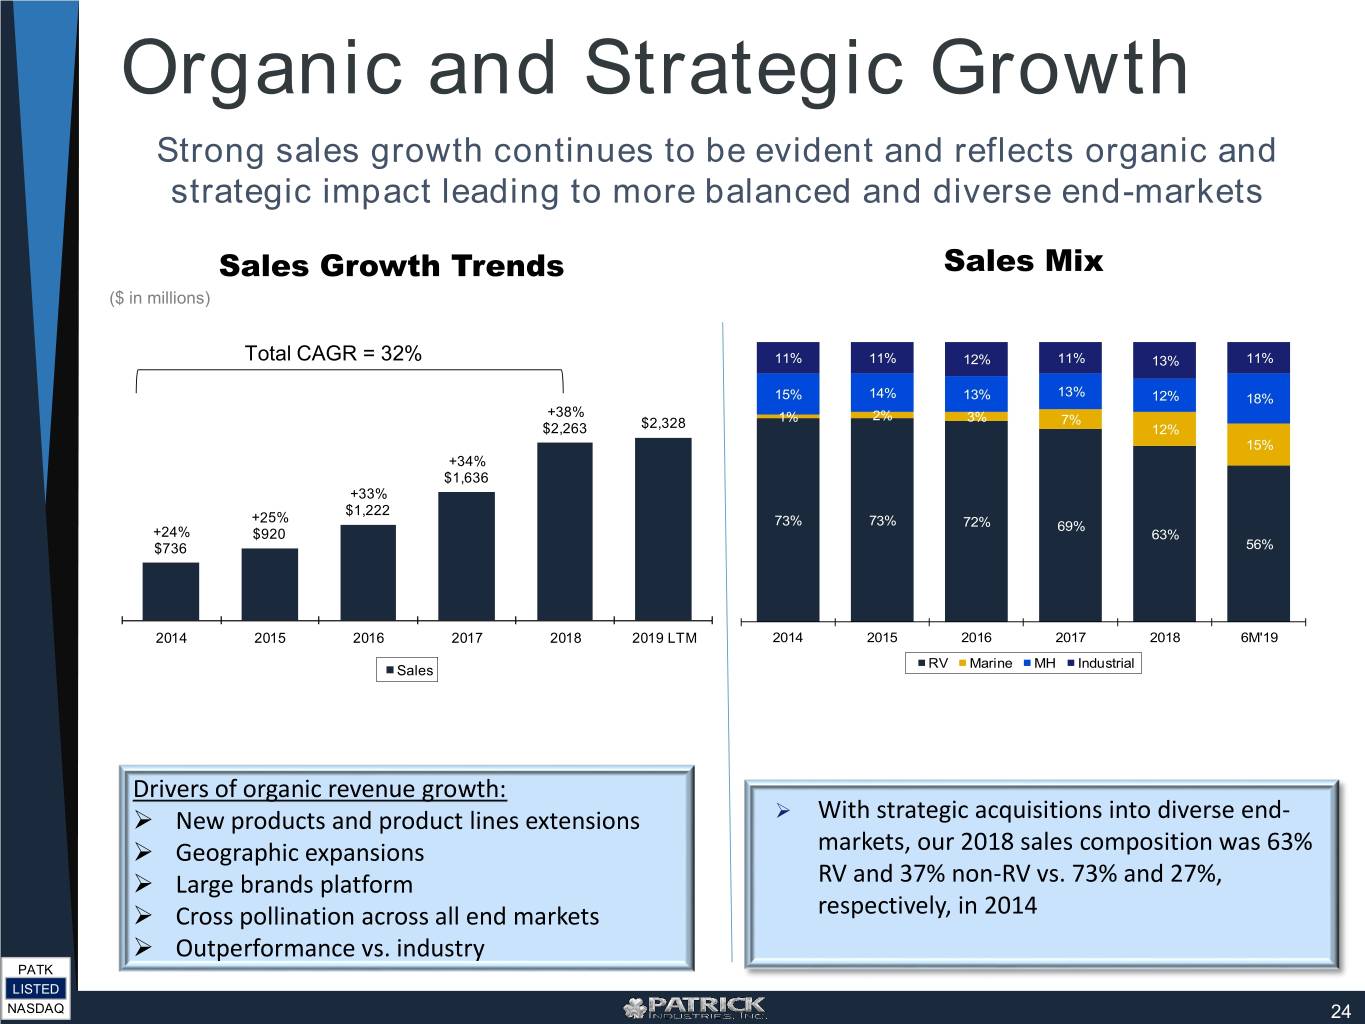
Organic and Strategic Growth Strong sales growth continues to be evident and reflects organic and strategic impact leading to more balanced and diverse end-markets Sales Growth Trends Sales Mix ($ in millions) Total CAGR = 32% 11% 11% 12% 11% 13% 11% 13% 15% 14% 13% 12% 18% +38% 1% 2% 3% 7% $2,263 $2,328 12% 15% +34% $1,636 +33% $1,222 +25% 73% 73% 72% 69% +24% $920 63% $736 56% 2014 2015 2016 2017 2018 2019 LTM 2014 2015 2016 2017 2018 6M'19 RV Marine MH Industrial Sales Drivers of organic revenue growth: New products and product lines extensions With strategic acquisitions into diverse end- Geographic expansions markets, our 2018 sales composition was 63% Large brands platform RV and 37% non-RV vs. 73% and 27%, Cross pollination across all end markets respectively, in 2014 Outperformance vs. industry PATK LISTED NASDAQ 24
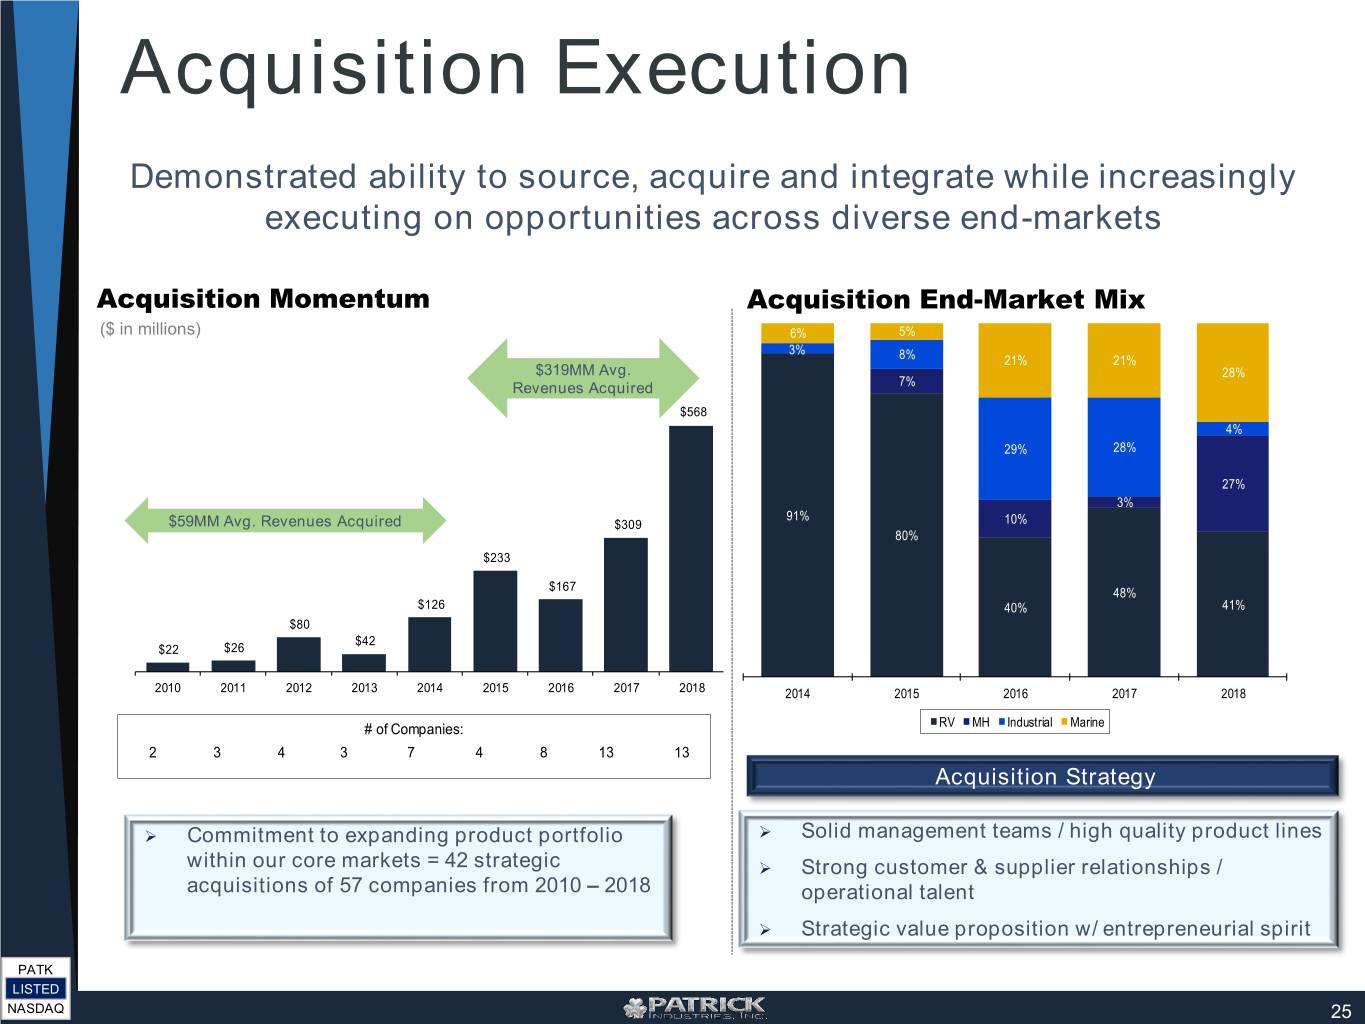
Acquisition Execution Demonstrated ability to source, acquire and integrate while increasingly executing on opportunities across diverse end-markets Acquisition Momentum Acquisition End-Market Mix ($ in millions) 6% 5% 3% 8% 21% 21% $319MM Avg. 28% Revenues Acquired 7% $568 4% 29% 28% 27% 3% 91% $59MM Avg. Revenues Acquired $309 10% 80% $233 $167 48% $126 40% 41% $80 $42 $22 $26 2010 2011 2012 2013 2014 2015 2016 2017 2018 2014 2015 2016 2017 2018 # of Companies: RV MH Industrial Marine 2 3 4 3 7 4 8 13 13 Acquisition Strategy Commitment to expanding product portfolio Solid management teams / high quality product lines within our core markets = 42 strategic Strong customer & supplier relationships / acquisitions of 57 companies from 2010 – 2018 operational talent Strategic value proposition w/ entrepreneurial spirit PATK LISTED NASDAQ 25
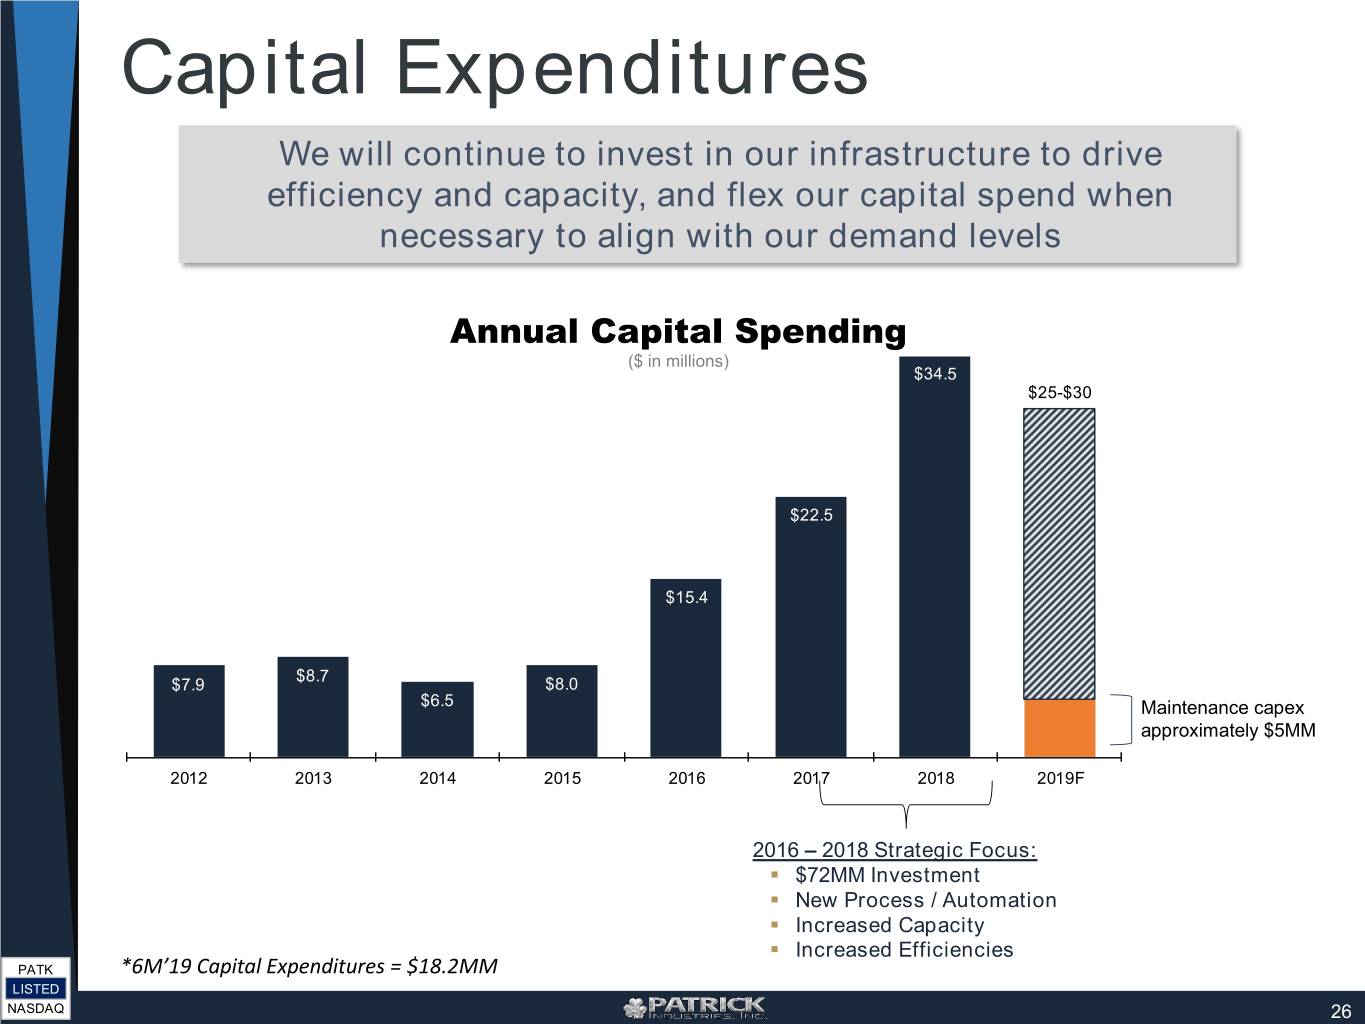
Capital Expenditures We will continue to invest in our infrastructure to drive efficiency and capacity, and flex our capital spend when necessary to align with our demand levels Annual Capital Spending ($ in millions) $34.5 $25-$30 $22.5 $15.4 $8.7 $7.9 $8.0 $6.5 Maintenance capex approximately $5MM 2012 2013 2014 2015 2016 2017 2018 2019F 2016 – 2018 Strategic Focus: . $72MM Investment . New Process / Automation . Increased Capacity . Increased Efficiencies PATK *6M’19 Capital Expenditures = $18.2MM LISTED NASDAQ 26
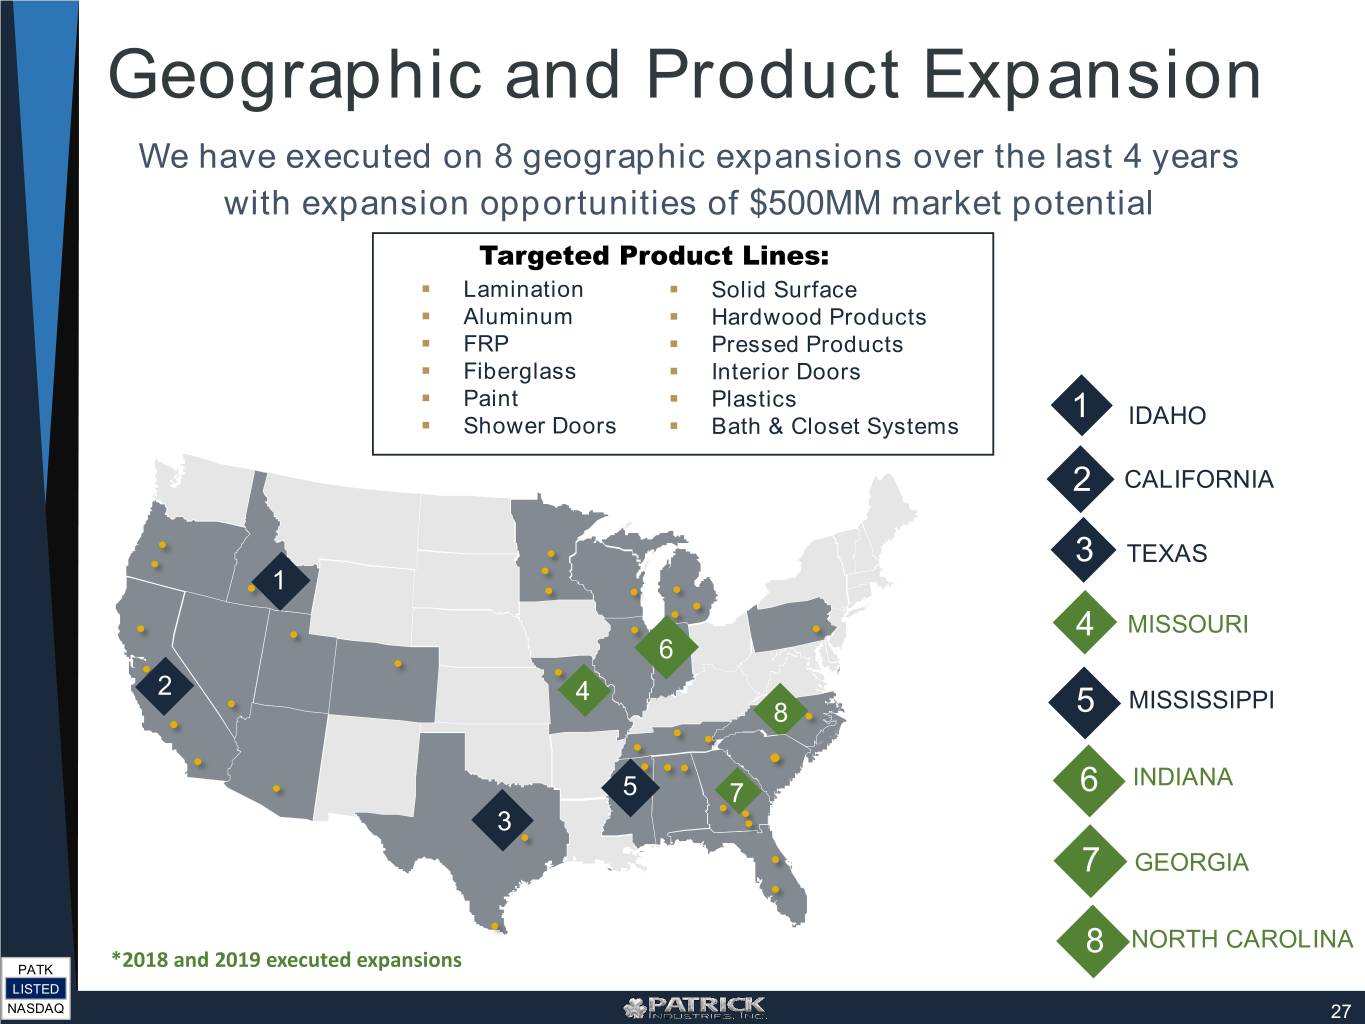
Geographic and Product Expansion We have executed on 8 geographic expansions over the last 4 years with expansion opportunities of $500MM market potential Targeted Product Lines: . Lamination . Solid Surface . Aluminum . Hardwood Products . FRP . Pressed Products . Fiberglass . Interior Doors . Paint . Plastics 1 . Shower Doors . Bath & Closet Systems IDAHO 2 CALIFORNIA 3 TEXAS 1 4 MISSOURI 6 2 4 8 5 MISSISSIPPI INDIANA 5 7 6 3 7 GEORGIA 8 NORTH CAROLINA PATK *2018 and 2019 executed expansions LISTED NASDAQ 27


Appendix PATK LISTED NASDAQ
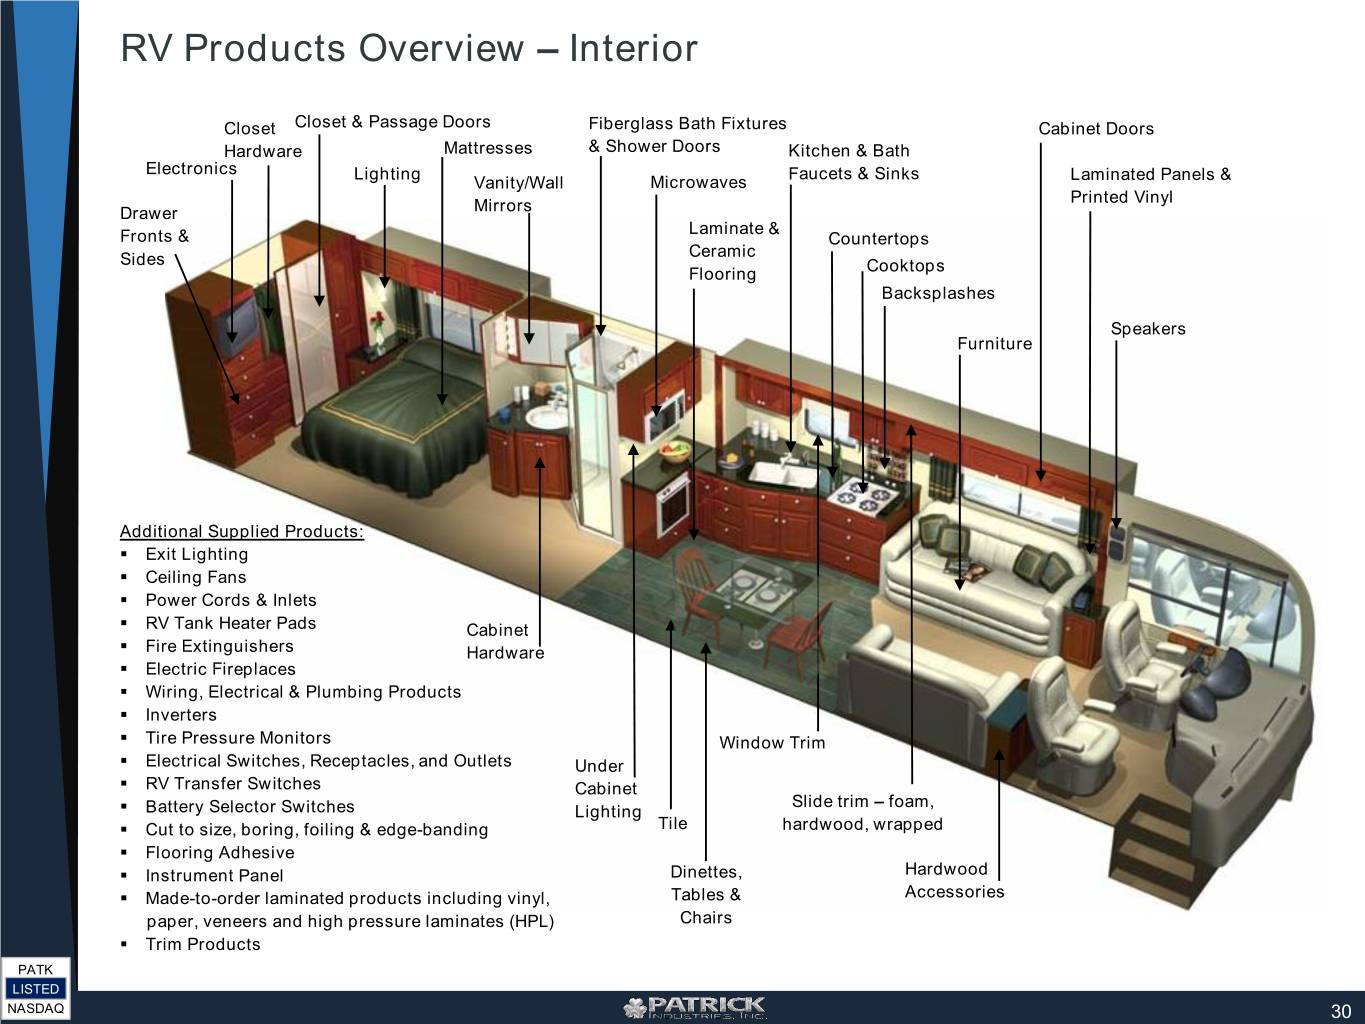
RV Products Overview – Interior Closet Closet & Passage Doors Fiberglass Bath Fixtures Cabinet Doors Hardware Mattresses & Shower Doors Kitchen & Bath Electronics Lighting Faucets & Sinks Laminated Panels & Vanity/Wall Microwaves Printed Vinyl Drawer Mirrors Laminate & Fronts & Countertops Sides Ceramic Flooring Cooktops Backsplashes Speakers Furniture Additional Supplied Products: . Exit Lighting . Ceiling Fans . Power Cords & Inlets . RV Tank Heater Pads Cabinet . Fire Extinguishers Hardware . Electric Fireplaces . Wiring, Electrical & Plumbing Products . Inverters . Tire Pressure Monitors Window Trim . Electrical Switches, Receptacles, and Outlets Under . RV Transfer Switches Cabinet Slide trim – foam, . Battery Selector Switches Lighting . Cut to size, boring, foiling & edge-banding Tile hardwood, wrapped . Flooring Adhesive . Instrument Panel Dinettes, Hardwood . Made-to-order laminated products including vinyl, Tables & Accessories paper, veneers and high pressure laminates (HPL) Chairs . Trim Products PATK LISTED NASDAQ 30
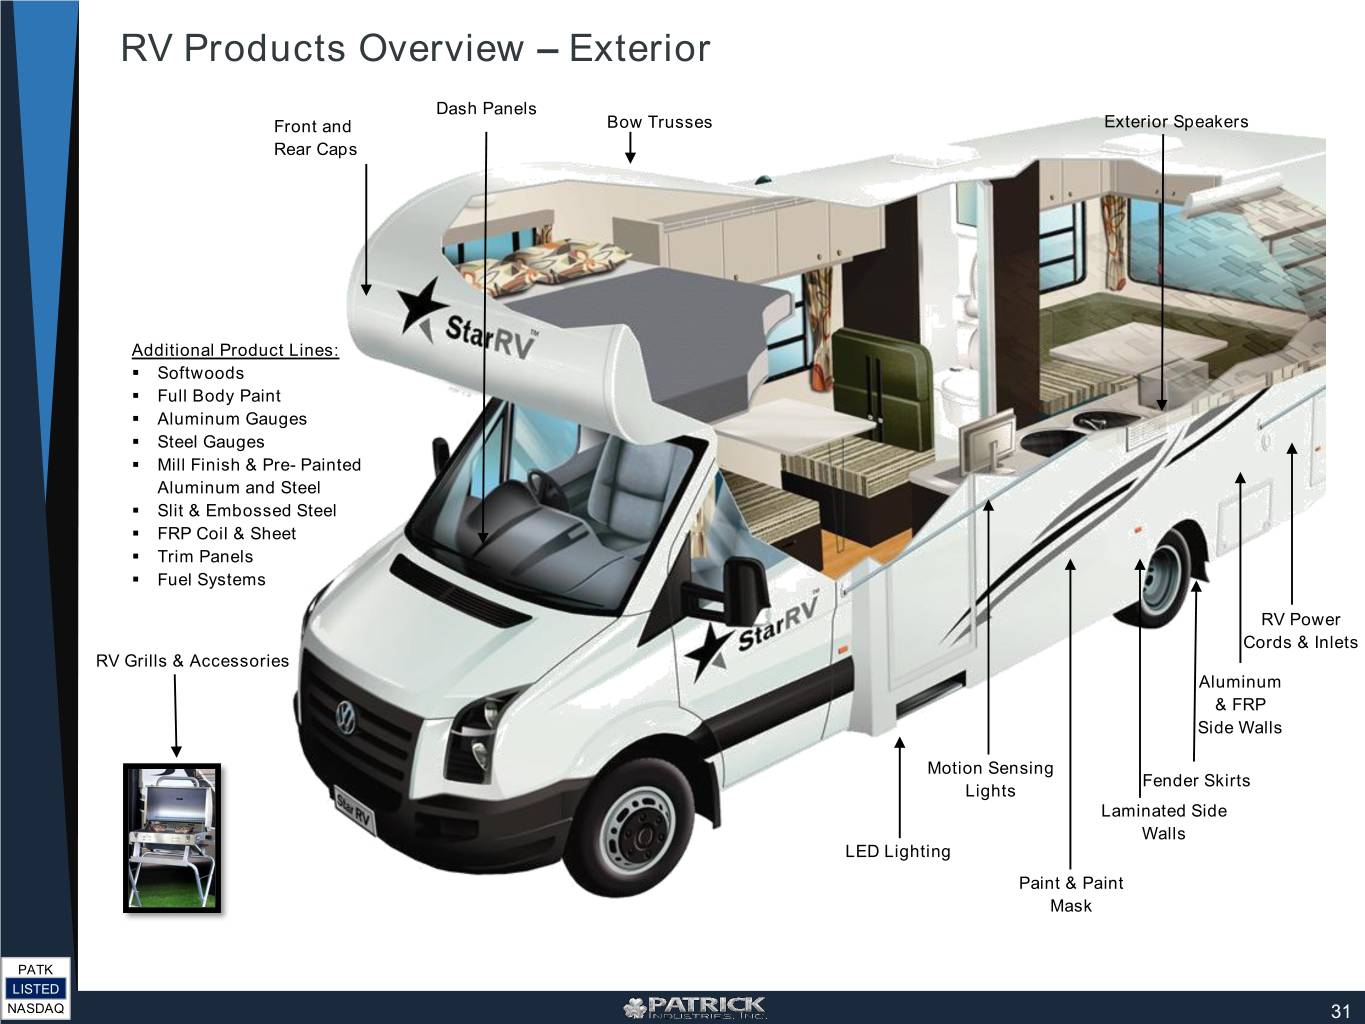
RV Products Overview – Exterior Dash Panels Front and Bow Trusses Exterior Speakers Rear Caps Additional Product Lines: . Softwoods . Full Body Paint . Aluminum Gauges . Steel Gauges . Mill Finish & Pre- Painted Aluminum and Steel . Slit & Embossed Steel . FRP Coil & Sheet . Trim Panels . Fuel Systems RV Power Cords & Inlets RV Grills & Accessories Aluminum & FRP Side Walls Motion Sensing Fender Skirts Lights Laminated Side Walls LED Lighting Paint & Paint Mask PATK LISTED NASDAQ 31
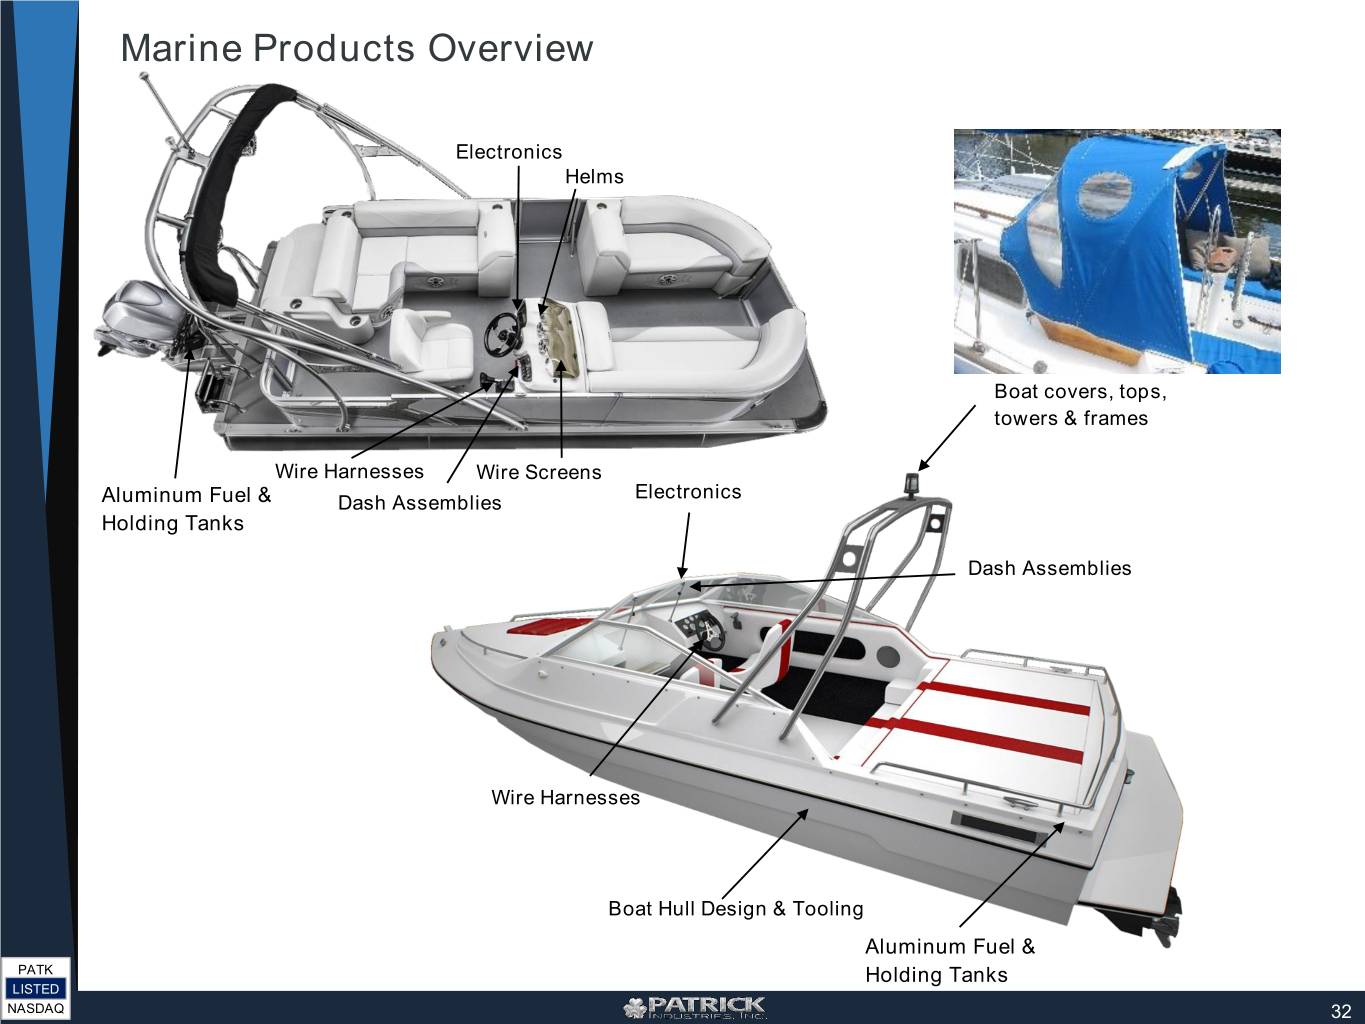
Marine Products Overview Electronics Helms Boat covers, tops, towers & frames Wire Harnesses Wire Screens Electronics Aluminum Fuel & Dash Assemblies Holding Tanks Dash Assemblies Wire Harnesses Boat Hull Design & Tooling Aluminum Fuel & PATK Holding Tanks LISTED NASDAQ 32
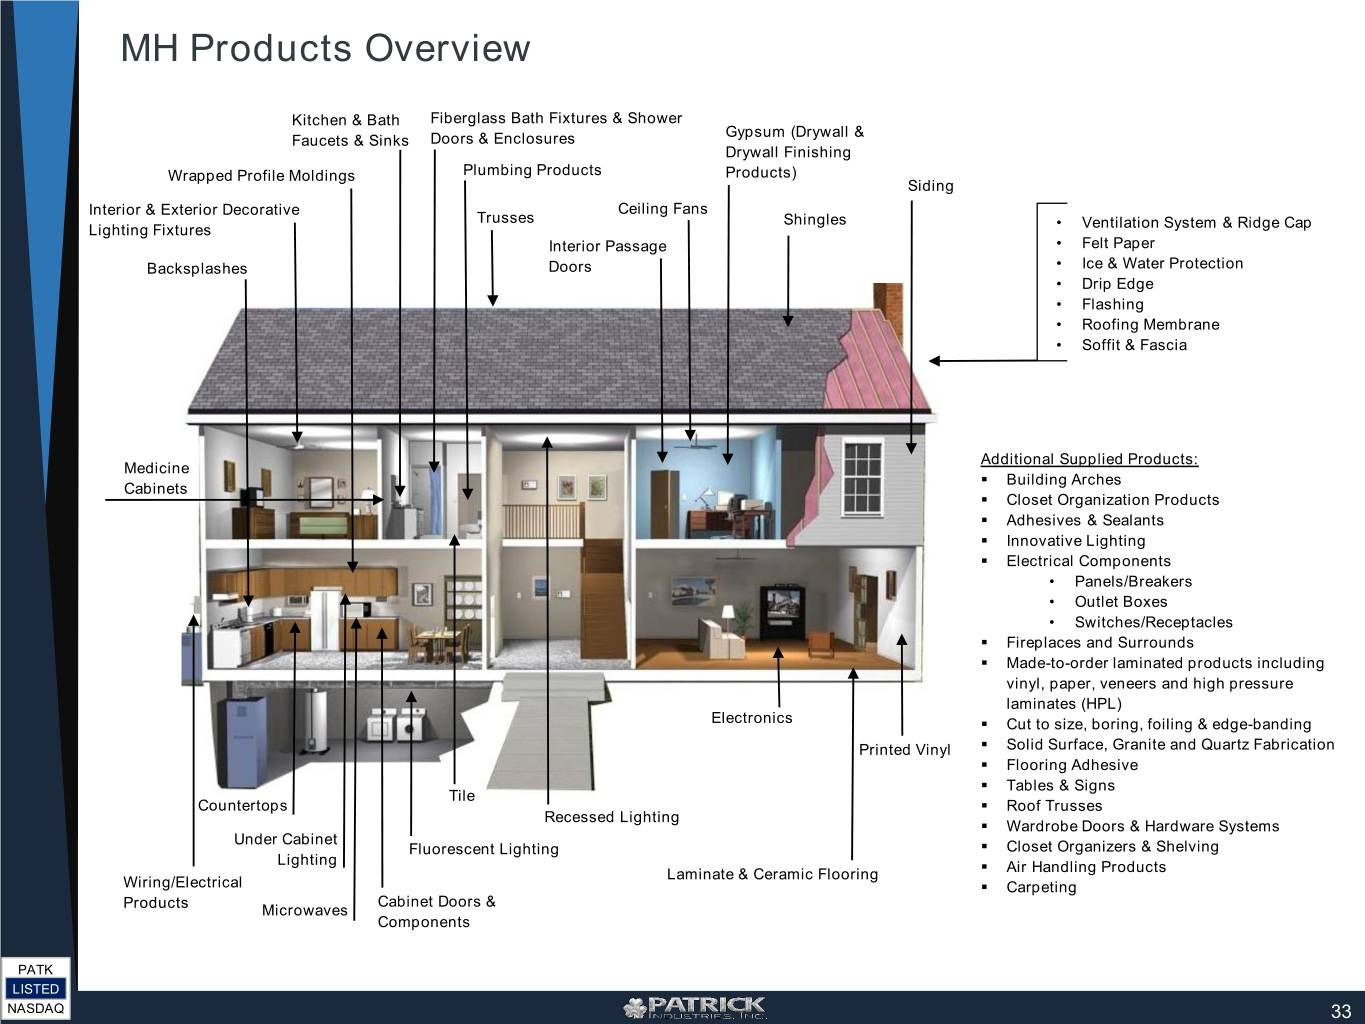
MH Products Overview Kitchen & Bath Fiberglass Bath Fixtures & Shower Gypsum (Drywall & Faucets & Sinks Doors & Enclosures Drywall Finishing Wrapped Profile Moldings Plumbing Products Products) Siding Interior & Exterior Decorative Ceiling Fans Trusses Shingles Lighting Fixtures • Ventilation System & Ridge Cap Interior Passage • Felt Paper Backsplashes Doors • Ice & Water Protection • Drip Edge • Flashing • Roofing Membrane • Soffit & Fascia Additional Supplied Products: Medicine . Building Arches Cabinets . Closet Organization Products . Adhesives & Sealants . Innovative Lighting . Electrical Components • Panels/Breakers • Outlet Boxes • Switches/Receptacles . Fireplaces and Surrounds . Made-to-order laminated products including vinyl, paper, veneers and high pressure laminates (HPL) Electronics . Cut to size, boring, foiling & edge-banding Printed Vinyl . Solid Surface, Granite and Quartz Fabrication . Flooring Adhesive . Tables & Signs Tile Countertops . Roof Trusses Recessed Lighting . Wardrobe Doors & Hardware Systems Under Cabinet Fluorescent Lighting . Closet Organizers & Shelving Lighting Laminate & Ceramic Flooring . Air Handling Products Wiring/Electrical . Carpeting Cabinet Doors & Products Microwaves Components PATK LISTED NASDAQ 33
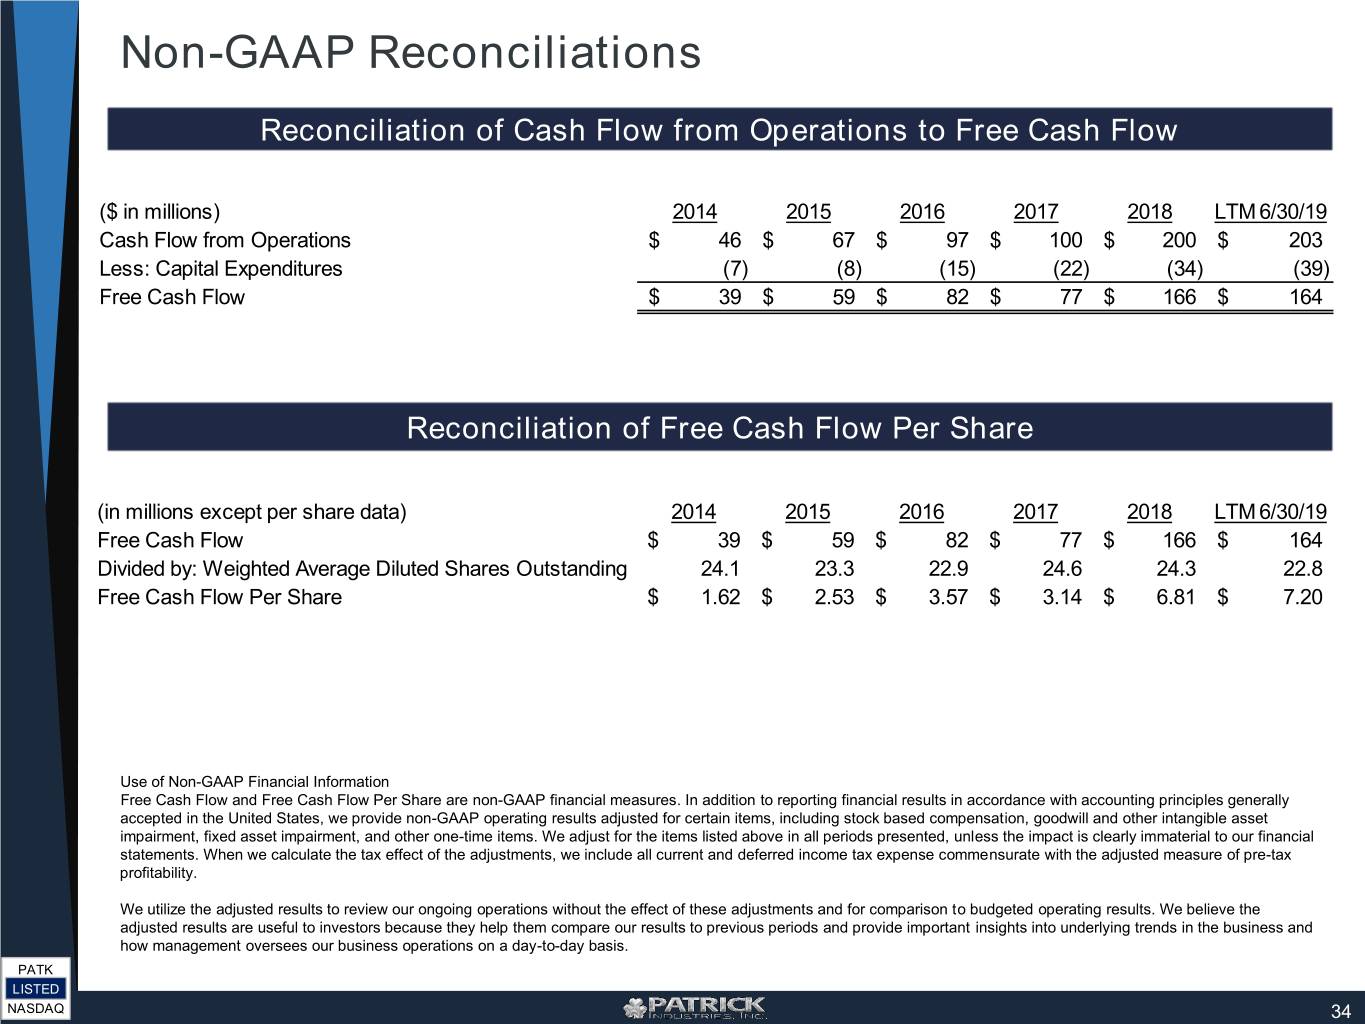
Non-GAAP Reconciliations Reconciliation of Cash Flow from Operations to Free Cash Flow ($ in millions) 2014 2015 2016 2017 2018 LTM 6/30/19 Cash Flow from Operations $ 46 $ 67 $ 97 $ 100 $ 200 $ 203 Less: Capital Expenditures (7) (8) (15) (22) (34) (39) Free Cash Flow $ 39 $ 59 $ 82 $ 77 $ 166 $ 164 Reconciliation of Free Cash Flow Per Share (in millions except per share data) 2014 2015 2016 2017 2018 LTM 6/30/19 Free Cash Flow $ 39 $ 59 $ 82 $ 77 $ 166 $ 164 Divided by: Weighted Average Diluted Shares Outstanding 24.1 23.3 22.9 24.6 24.3 22.8 Free Cash Flow Per Share $ 1.62 $ 2.53 $ 3.57 $ 3.14 $ 6.81 $ 7.20 Use of Non-GAAP Financial Information Free Cash Flow and Free Cash Flow Per Share are non-GAAP financial measures. In addition to reporting financial results in accordance with accounting principles generally accepted in the United States, we provide non-GAAP operating results adjusted for certain items, including stock based compensation, goodwill and other intangible asset impairment, fixed asset impairment, and other one-time items. We adjust for the items listed above in all periods presented, unless the impact is clearly immaterial to our financial statements. When we calculate the tax effect of the adjustments, we include all current and deferred income tax expense commensurate with the adjusted measure of pre-tax profitability. We utilize the adjusted results to review our ongoing operations without the effect of these adjustments and for comparison to budgeted operating results. We believe the adjusted results are useful to investors because they help them compare our results to previous periods and provide important insights into underlying trends in the business and how management oversees our business operations on a day-to-day basis. PATK LISTED NASDAQ 34