EX-99.1
Published on January 13, 2021

INVESTOR PRESENTATION January 2021
Investor Presentation – January 2021 FORWARD-LOOKING STATEMENTS This presentation contains certain statements related to future results, our intentions, beliefs and expectations or predictions for the future which are forward-looking statements as that term is defined in the Private Securities Litigation Reform Act of 1995. These forward-looking statements involve a number of risks and uncertainties that could cause actual results to differ materially from either historical or anticipated results depending on a variety of factors. These risks and uncertainties include, but are not limited to, the impact of the continuing financial and operations uncertainty due to the COVID-19 pandemic, including its impact on the overall economy, our sales, customers, operations, team members and suppliers. Further information concerning the Company and its business, including factors that potentially could materially affect the Company’s financial results, is contained in the Company’s filings with the Securities and Exchange Commission. This presentation includes market and industry data, forecasts and valuations that have been obtained from independent consultant reports, publicly available information, various industry publications and other published industry sources. Although we believe these sources are reliable, we have not independently verified the information and cannot make any representation as to the accuracy or completeness of such information. We disclaim any obligation or undertaking to disseminate any updates or revisions to any forward-looking statements contained in this presentation or to reflect any change in our expectations after the date of this presentation or any change in events, conditions or circumstances on which any statement is based. Use Of Non-GAAP Financial Measures This presentation contains non-GAAP financial measures. These measures, the purposes for which management uses them, why management believes they are useful to investors, and a reconciliation to the most directly comparable GAAP financial measures can be found in the Appendix of this presentation. All references to profit measures and earnings per share on a comparable basis exclude items that affect comparability. 2

Investor Presentation – January 2021 COMPANY OVERVIEW & HIGHLIGHTS
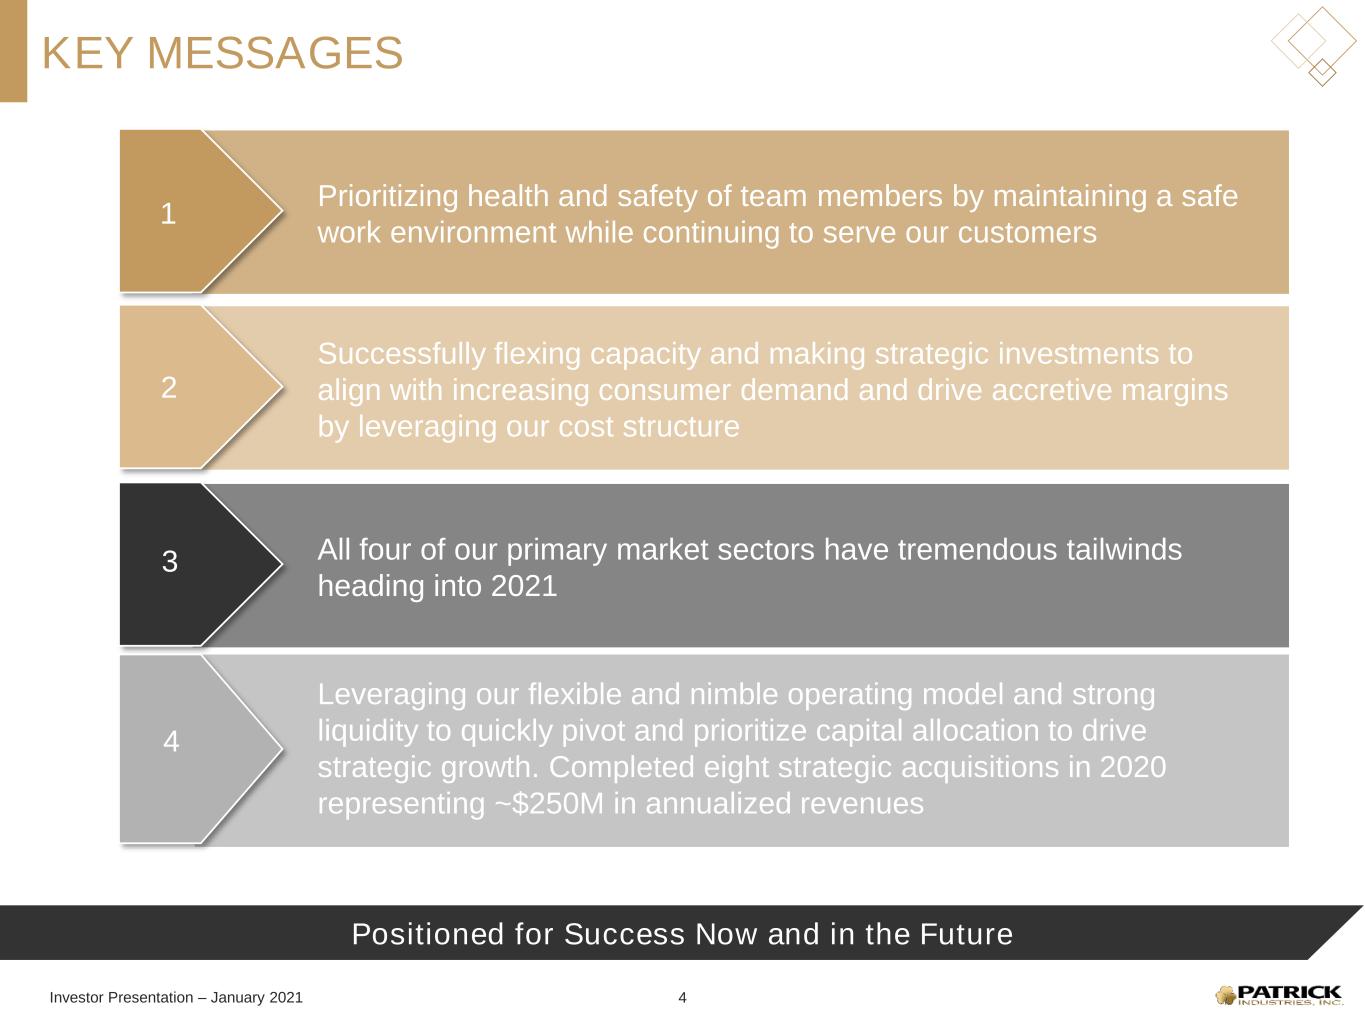
Investor Presentation – January 2021 Positioned for Success Now and in the Future KEY MESSAGES 4 Prioritizing health and safety of team members by maintaining a safe work environment while continuing to serve our customers Successfully flexing capacity and making strategic investments to align with increasing consumer demand and drive accretive margins by leveraging our cost structure All four of our primary market sectors have tremendous tailwinds heading into 2021 Leveraging our flexible and nimble operating model and strong liquidity to quickly pivot and prioritize capital allocation to drive strategic growth. Completed eight strategic acquisitions in 2020 representing ~$250M in annualized revenues 1 2 3 4
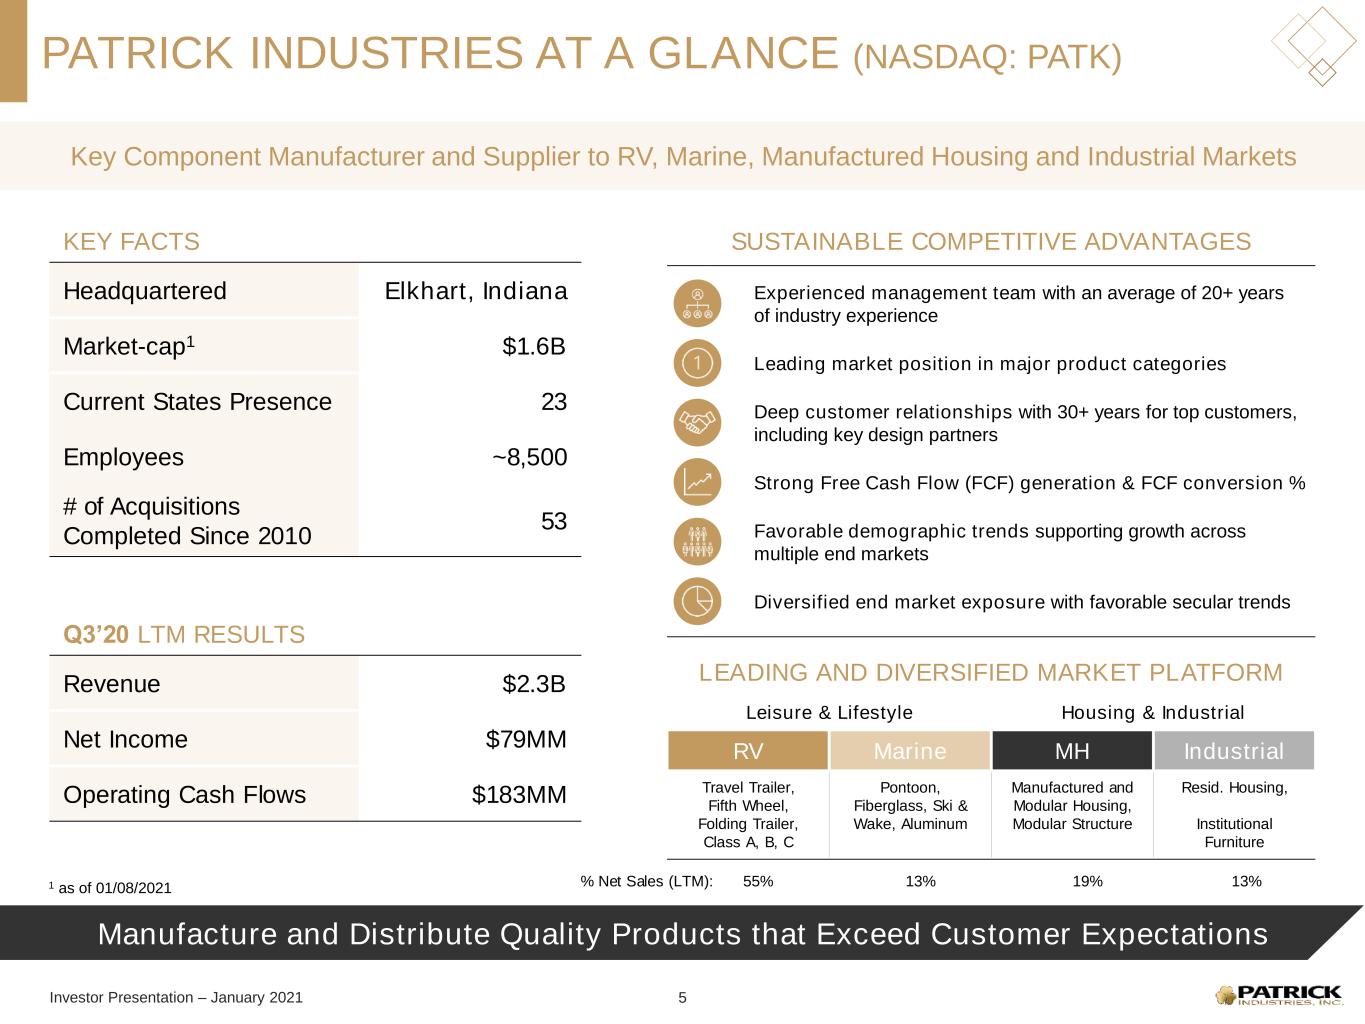
Investor Presentation – January 2021 Manufacture and Distribute Quality Products that Exceed Customer Expectations PATRICK INDUSTRIES AT A GLANCE (NASDAQ: PATK) KEY FACTS Headquartered Elkhart, Indiana Market-cap1 $1.6B Current States Presence 23 Employees ~8,500 # of Acquisitions Completed Since 2010 53 Q3’20 LTM RESULTS Revenue $2.3B Net Income $79MM Operating Cash Flows $183MM SUSTAINABLE COMPETITIVE ADVANTAGES Experienced management team with an average of 20+ years of industry experience Leading market position in major product categories Favorable demographic trends supporting growth across multiple end markets Strong Free Cash Flow (FCF) generation & FCF conversion % Deep customer relationships with 30+ years for top customers, including key design partners Diversified end market exposure with favorable secular trends 1 as of 01/08/2021 Key Component Manufacturer and Supplier to RV, Marine, Manufactured Housing and Industrial Markets LEADING AND DIVERSIFIED MARKET PLATFORM Leisure & Lifestyle Housing & Industrial RV Marine MH Industrial Travel Trailer, Fifth Wheel, Folding Trailer, Class A, B, C Pontoon, Fiberglass, Ski & Wake, Aluminum Manufactured and Modular Housing, Modular Structure Resid. Housing, Institutional Furniture 5 % Net Sales (LTM): 55% 13% 19% 13%
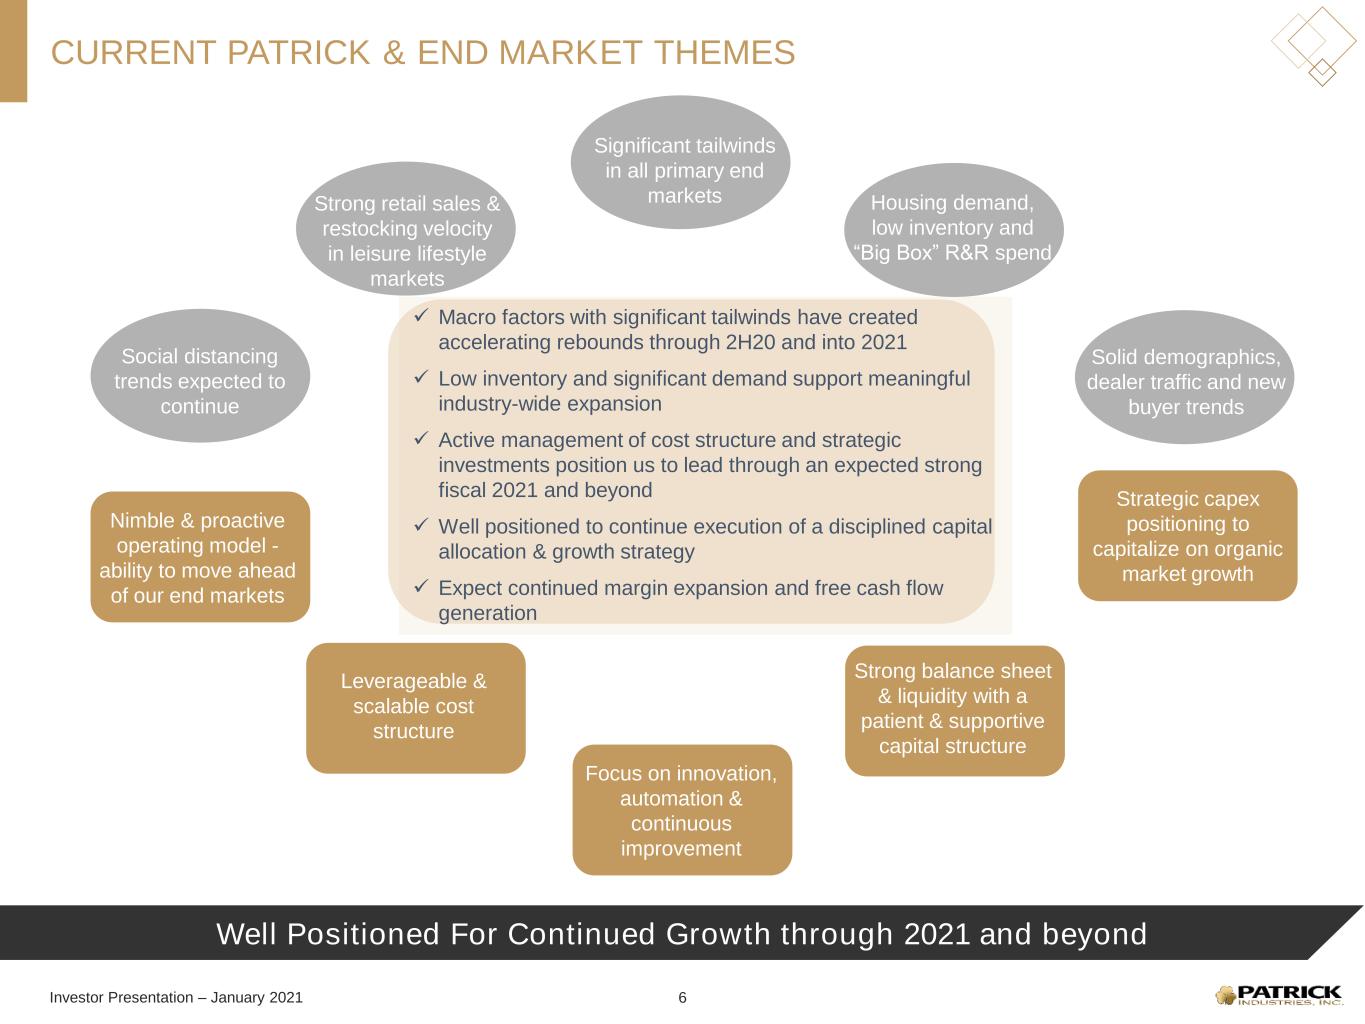
Investor Presentation – January 2021 Well Positioned For Continued Growth through 2021 and beyond CURRENT PATRICK & END MARKET THEMES 6 Social distancing trends expected to continue Strong retail sales & restocking velocity in leisure lifestyle markets Solid demographics, dealer traffic and new buyer trends Focus on innovation, automation & continuous improvement Leverageable & scalable cost structure Strong balance sheet & liquidity with a patient & supportive capital structure Strategic capex positioning to capitalize on organic market growth Nimble & proactive operating model - ability to move ahead of our end markets Significant tailwinds in all primary end markets Housing demand, low inventory and “Big Box” R&R spend Macro factors with significant tailwinds have created accelerating rebounds through 2H20 and into 2021 Low inventory and significant demand support meaningful industry-wide expansion Active management of cost structure and strategic investments position us to lead through an expected strong fiscal 2021 and beyond Well positioned to continue execution of a disciplined capital allocation & growth strategy Expect continued margin expansion and free cash flow generation
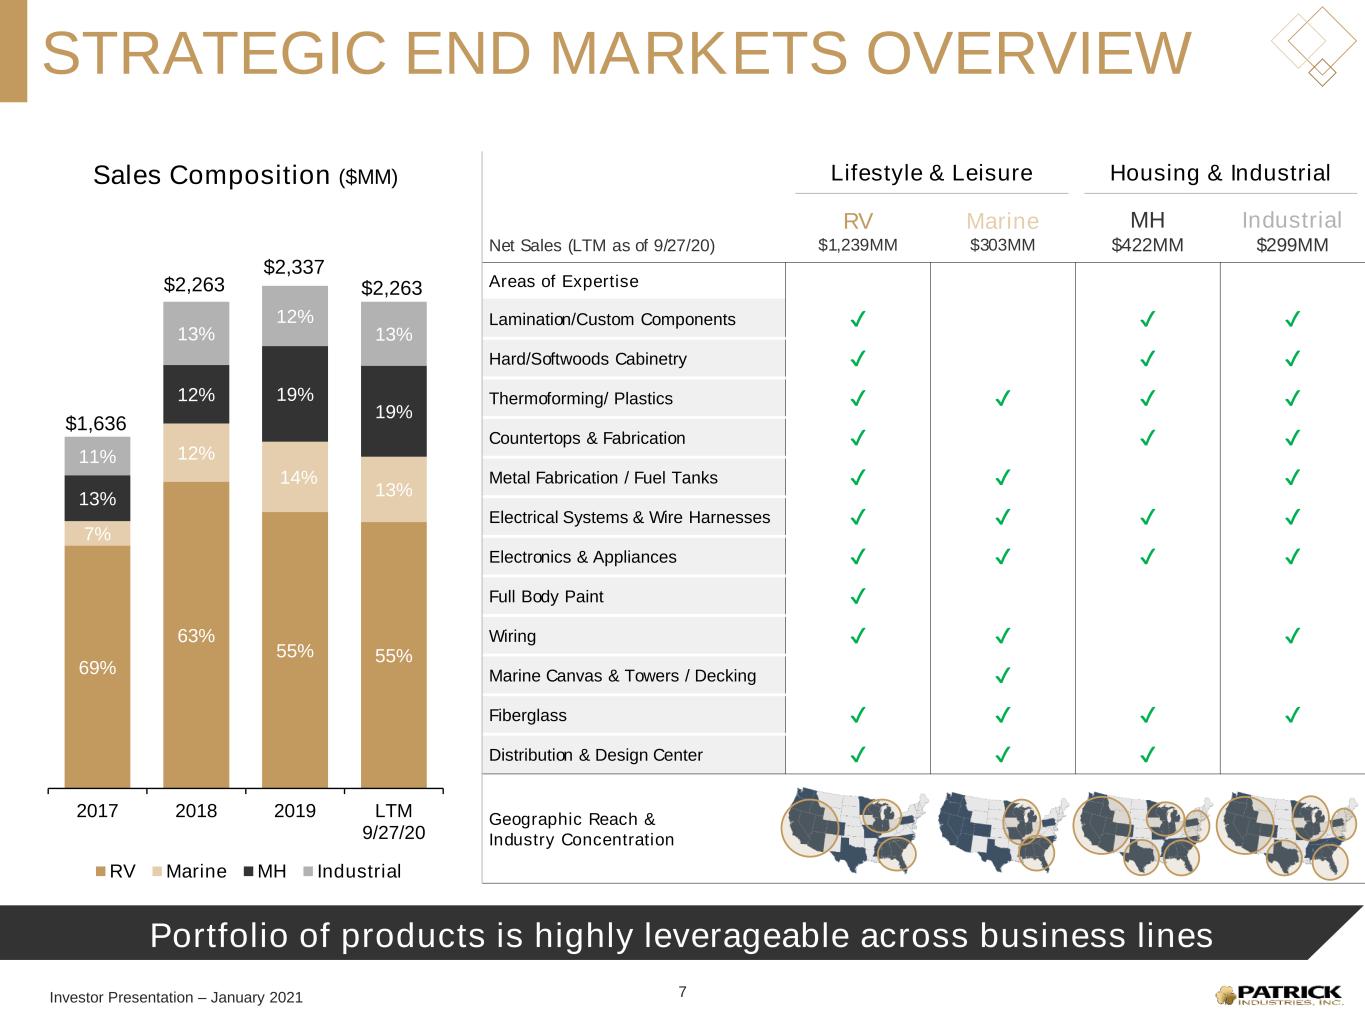
Investor Presentation – January 2021 Portfolio of products is highly leverageable across business lines STRATEGIC END MARKETS OVERVIEW 69% 63% 55% 55% 7% 12% 14% 13% 13% 12% 19% 19% 11% 13% 12% 13% 2017 2018 2019 LTM 9/27/20 RV Marine MH Industrial Sales Composition ($MM) $1,636 $2,263 $2,337 Net Sales (LTM as of 9/27/20) RV $1,239MM Marine $303MM MH $422MM Industrial $299MM Areas of Expertise Lamination/Custom Components ✔ ✔ ✔ Hard/Softwoods Cabinetry ✔ ✔ ✔ Thermoforming/ Plastics ✔ ✔ ✔ ✔ Countertops & Fabrication ✔ ✔ ✔ Metal Fabrication / Fuel Tanks ✔ ✔ ✔ Electrical Systems & Wire Harnesses ✔ ✔ ✔ ✔ Electronics & Appliances ✔ ✔ ✔ ✔ Full Body Paint ✔ Wiring ✔ ✔ ✔ Marine Canvas & Towers / Decking ✔ Fiberglass ✔ ✔ ✔ ✔ Distribution & Design Center ✔ ✔ ✔ Geographic Reach & Industry Concentration Lifestyle & Leisure Housing & Industrial $2,263 7
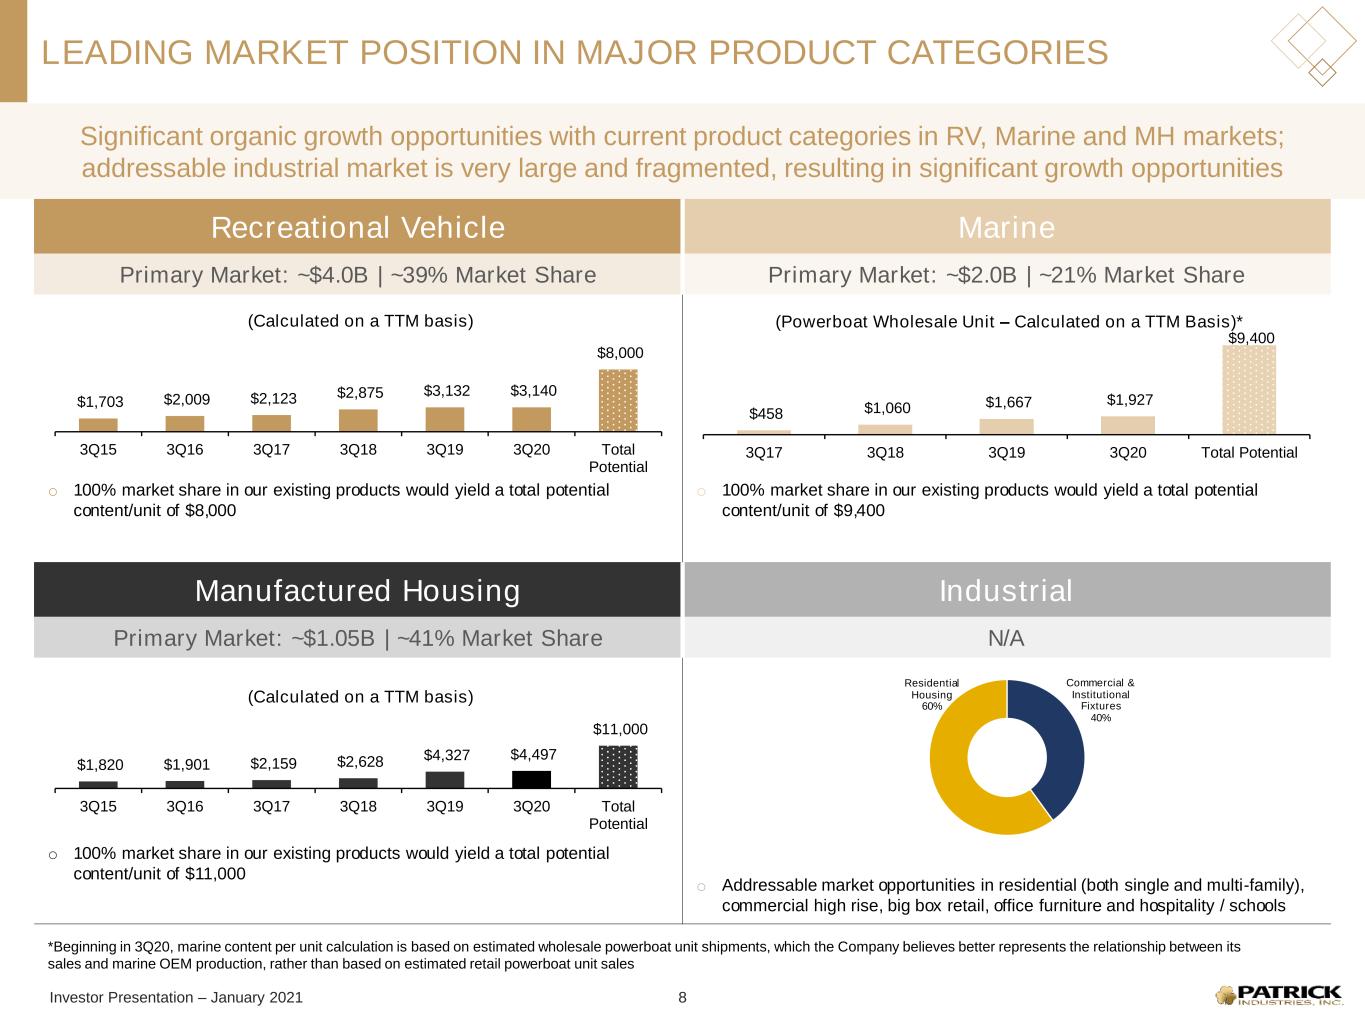
Investor Presentation – January 2021 LEADING MARKET POSITION IN MAJOR PRODUCT CATEGORIES Significant organic growth opportunities with current product categories in RV, Marine and MH markets; addressable industrial market is very large and fragmented, resulting in significant growth opportunities Recreational Vehicle Marine Primary Market: ~$4.0B | ~39% Market Share Primary Market: ~$2.0B | ~21% Market Share o 100% market share in our existing products would yield a total potential content/unit of $8,000 o 100% market share in our existing products would yield a total potential content/unit of $9,400 Manufactured Housing Industrial Primary Market: ~$1.05B | ~41% Market Share N/A o 100% market share in our existing products would yield a total potential content/unit of $11,000 o Addressable market opportunities in residential (both single and multi-family), commercial high rise, big box retail, office furniture and hospitality / schools $1,703 $2,009 $2,123 $2,875 $3,132 $3,140 $8,000 3Q15 3Q16 3Q17 3Q18 3Q19 3Q20 Total Potential (Calculated on a TTM basis) $458 $1,060 $1,667 $1,927 $9,400 3Q17 3Q18 3Q19 3Q20 Total Potential (Powerboat Wholesale Unit – Calculated on a TTM Basis)* $1,820 $1,901 $2,159 $2,628 $4,327 $4,497 $11,000 3Q15 3Q16 3Q17 3Q18 3Q19 3Q20 Total Potential (Calculated on a TTM basis) 8 *Beginning in 3Q20, marine content per unit calculation is based on estimated wholesale powerboat unit shipments, which the Company believes better represents the relationship between its sales and marine OEM production, rather than based on estimated retail powerboat unit sales Commercial & Institutional Fixtures 40% Residential Housing 60%
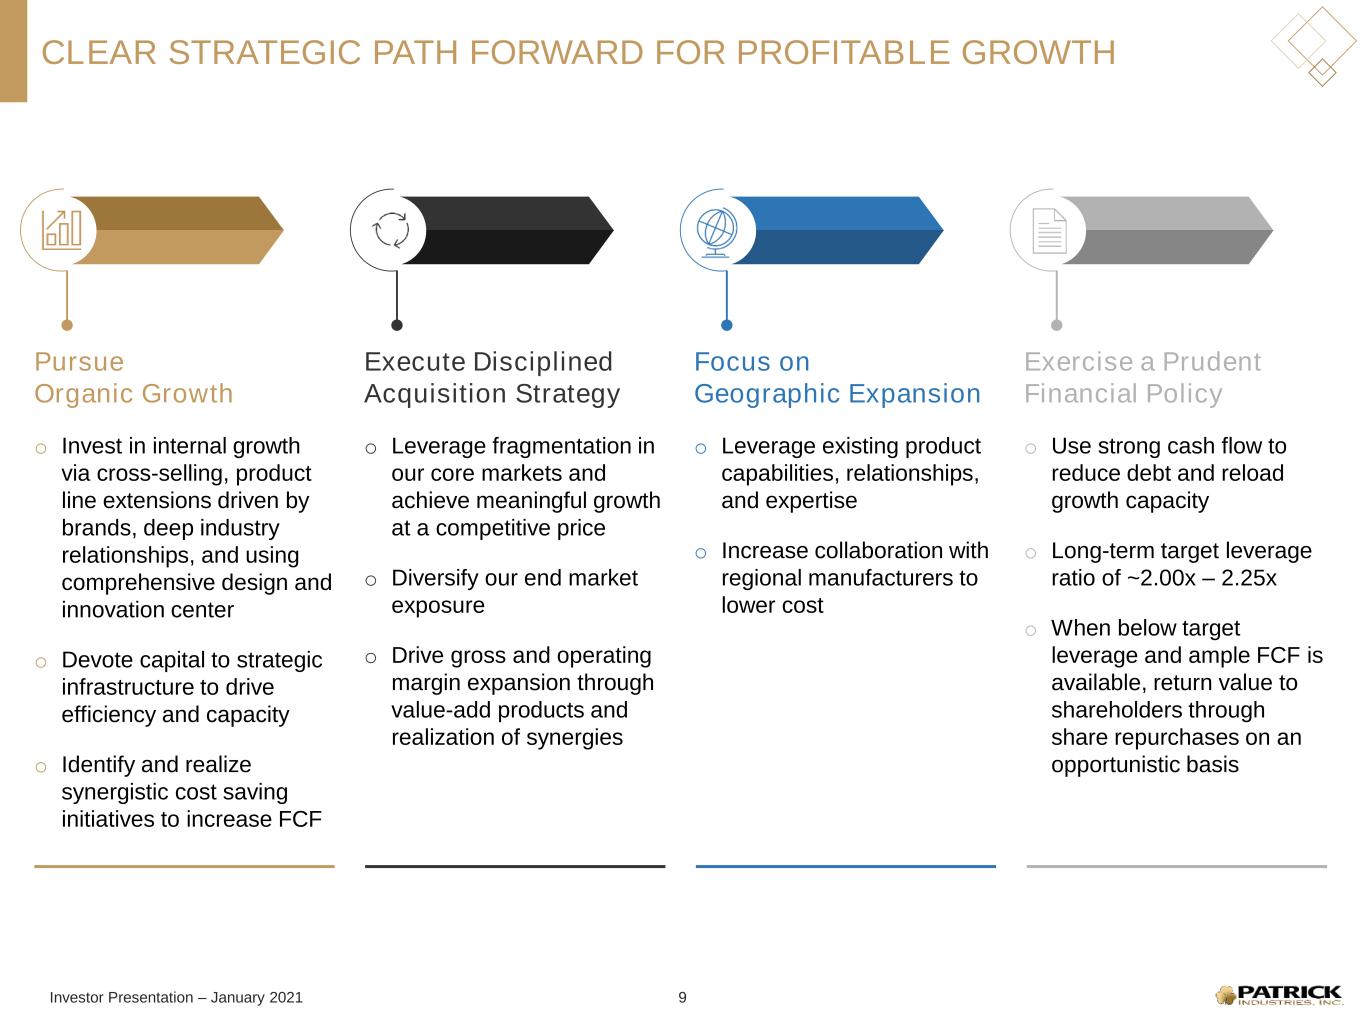
Investor Presentation – January 2021 CLEAR STRATEGIC PATH FORWARD FOR PROFITABLE GROWTH Pursue Organic Growth o Invest in internal growth via cross-selling, product line extensions driven by brands, deep industry relationships, and using comprehensive design and innovation center o Devote capital to strategic infrastructure to drive efficiency and capacity o Identify and realize synergistic cost saving initiatives to increase FCF Execute Disciplined Acquisition Strategy o Leverage fragmentation in our core markets and achieve meaningful growth at a competitive price o Diversify our end market exposure o Drive gross and operating margin expansion through value-add products and realization of synergies Focus on Geographic Expansion o Leverage existing product capabilities, relationships, and expertise o Increase collaboration with regional manufacturers to lower cost Exercise a Prudent Financial Policy o Use strong cash flow to reduce debt and reload growth capacity o Long-term target leverage ratio of ~2.00x – 2.25x o When below target leverage and ample FCF is available, return value to shareholders through share repurchases on an opportunistic basis 9
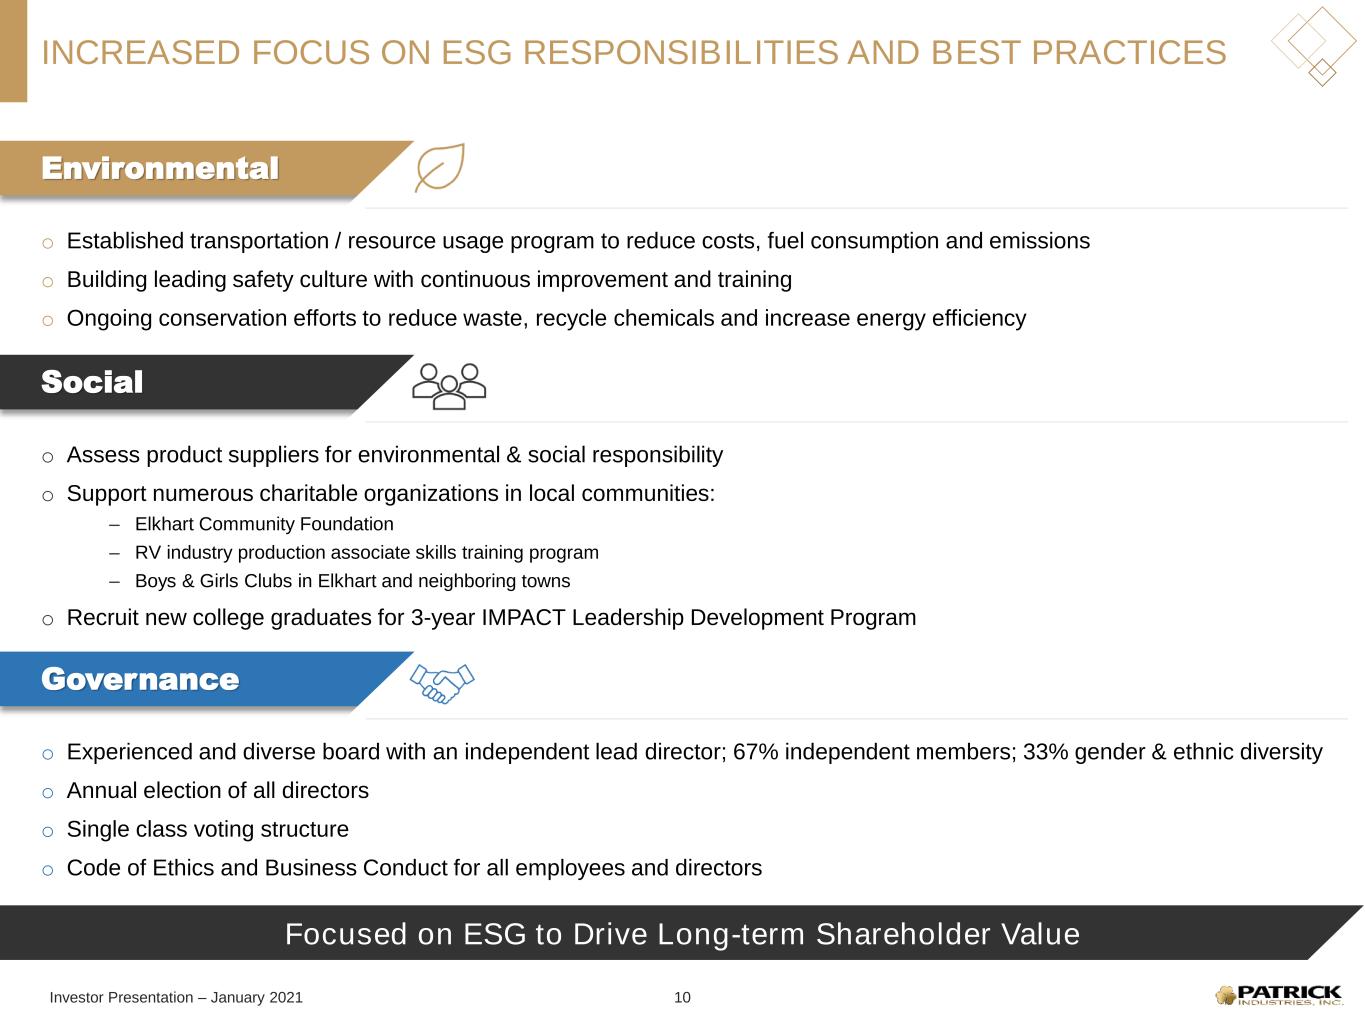
Investor Presentation – January 2021 Focused on ESG to Drive Long-term Shareholder Value INCREASED FOCUS ON ESG RESPONSIBILITIES AND BEST PRACTICES Environmental o Established transportation / resource usage program to reduce costs, fuel consumption and emissions o Building leading safety culture with continuous improvement and training o Ongoing conservation efforts to reduce waste, recycle chemicals and increase energy efficiency Social o Assess product suppliers for environmental & social responsibility o Support numerous charitable organizations in local communities: ‒ Elkhart Community Foundation ‒ RV industry production associate skills training program ‒ Boys & Girls Clubs in Elkhart and neighboring towns o Recruit new college graduates for 3-year IMPACT Leadership Development Program Governance o Experienced and diverse board with an independent lead director; 67% independent members; 33% gender & ethnic diversity o Annual election of all directors o Single class voting structure o Code of Ethics and Business Conduct for all employees and directors 10

Investor Presentation – January 2021 MARKET OVERVIEW
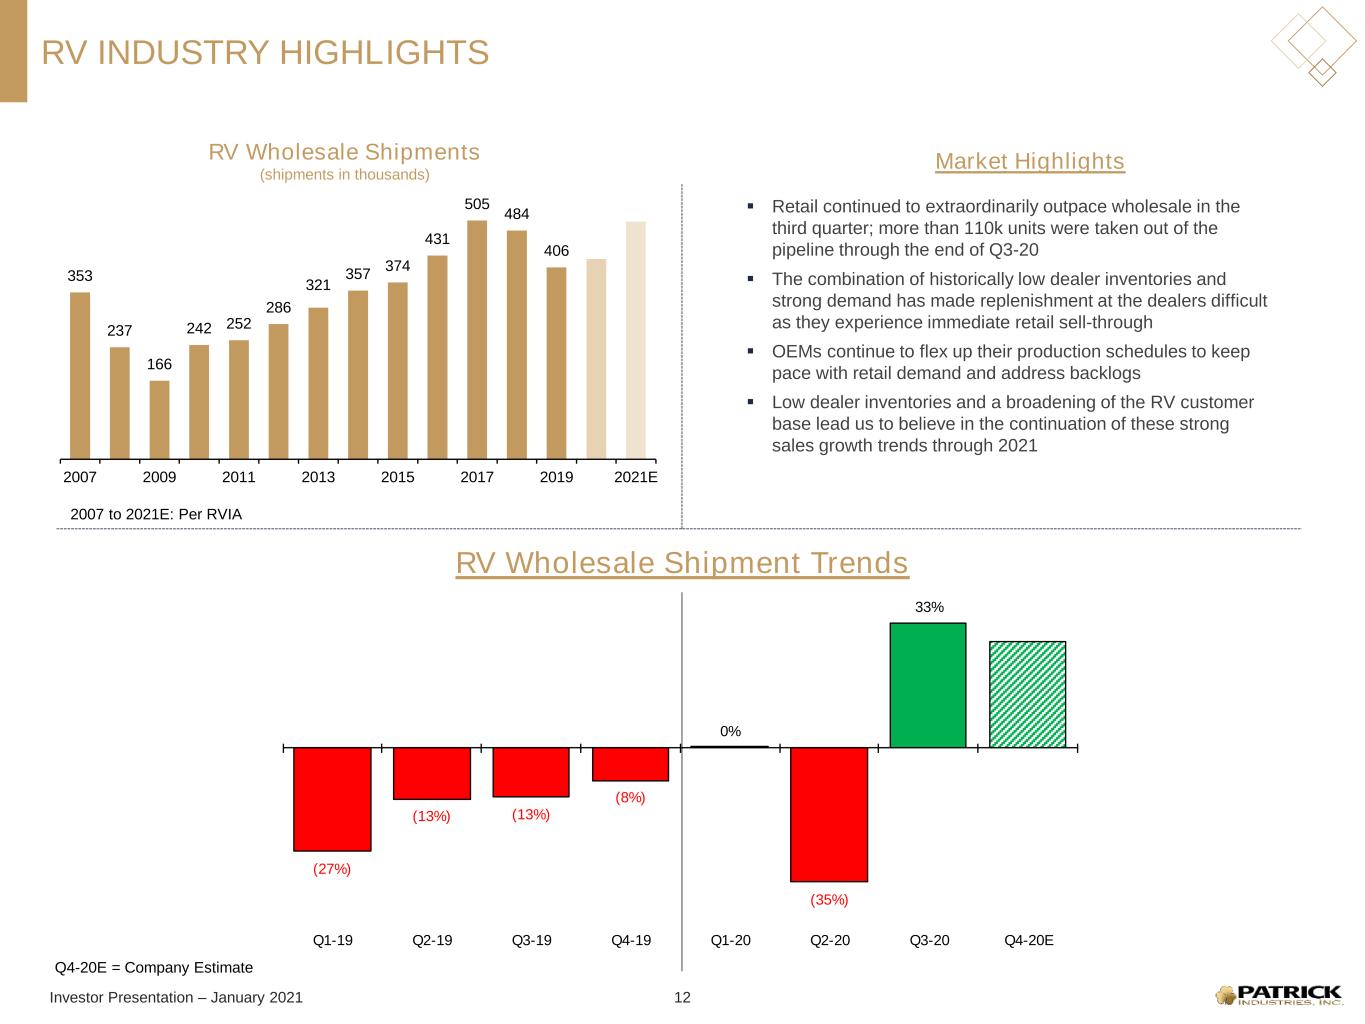
Investor Presentation – January 2021 RV INDUSTRY HIGHLIGHTS RV Wholesale Shipment Trends Market HighlightsRV Wholesale Shipments (shipments in thousands) Retail continued to extraordinarily outpace wholesale in the third quarter; more than 110k units were taken out of the pipeline through the end of Q3-20 The combination of historically low dealer inventories and strong demand has made replenishment at the dealers difficult as they experience immediate retail sell-through OEMs continue to flex up their production schedules to keep pace with retail demand and address backlogs Low dealer inventories and a broadening of the RV customer base lead us to believe in the continuation of these strong sales growth trends through 2021 353 237 166 242 252 286 321 357 374 431 505 484 406 2007 2009 2011 2013 2015 2017 2019 2021E 2007 to 2021E: Per RVIA 12 (27%) (13%) (13%) (8%) 0% (35%) 33% Q1-19 Q2-19 Q3-19 Q4-19 Q1-20 Q2-20 Q3-20 Q4-20E Q4-20E = Company Estimate
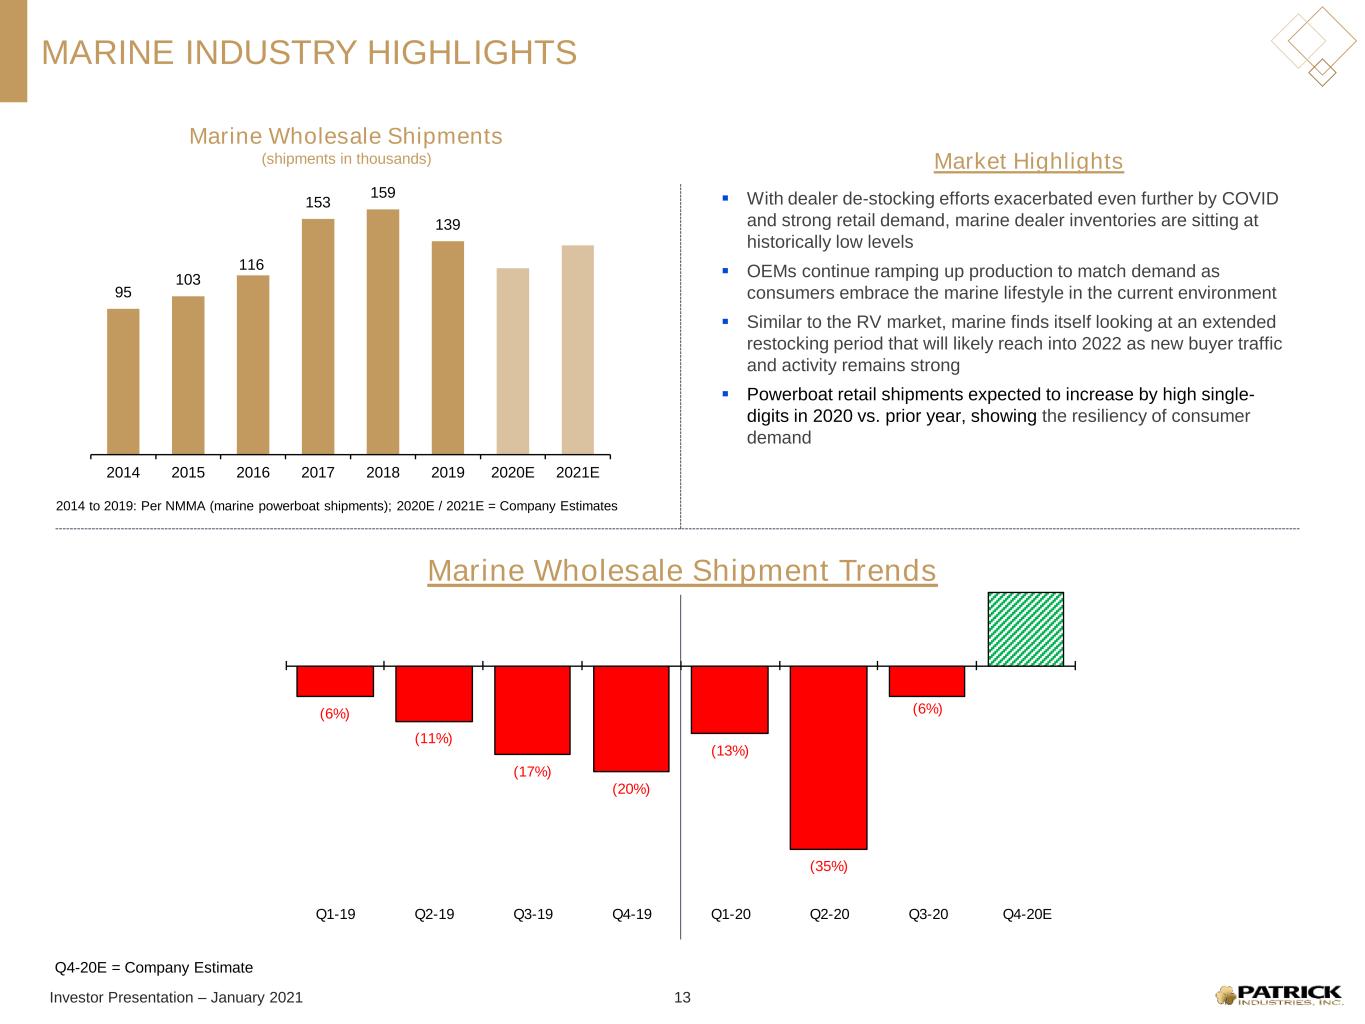
Investor Presentation – January 2021 MARINE INDUSTRY HIGHLIGHTS Marine Wholesale Shipment Trends Market Highlights Marine Wholesale Shipments (shipments in thousands) With dealer de-stocking efforts exacerbated even further by COVID and strong retail demand, marine dealer inventories are sitting at historically low levels OEMs continue ramping up production to match demand as consumers embrace the marine lifestyle in the current environment Similar to the RV market, marine finds itself looking at an extended restocking period that will likely reach into 2022 as new buyer traffic and activity remains strong Powerboat retail shipments expected to increase by high single- digits in 2020 vs. prior year, showing the resiliency of consumer demand 95 103 116 153 159 139 2014 2015 2016 2017 2018 2019 2020E 2021E 13 2014 to 2019: Per NMMA (marine powerboat shipments); 2020E / 2021E = Company Estimates Q4-20E = Company Estimate (6%) (11%) (17%) (20%) (13%) (35%) (6%) Q1-19 Q2-19 Q3-19 Q4-19 Q1-20 Q2-20 Q3-20 Q4-20E
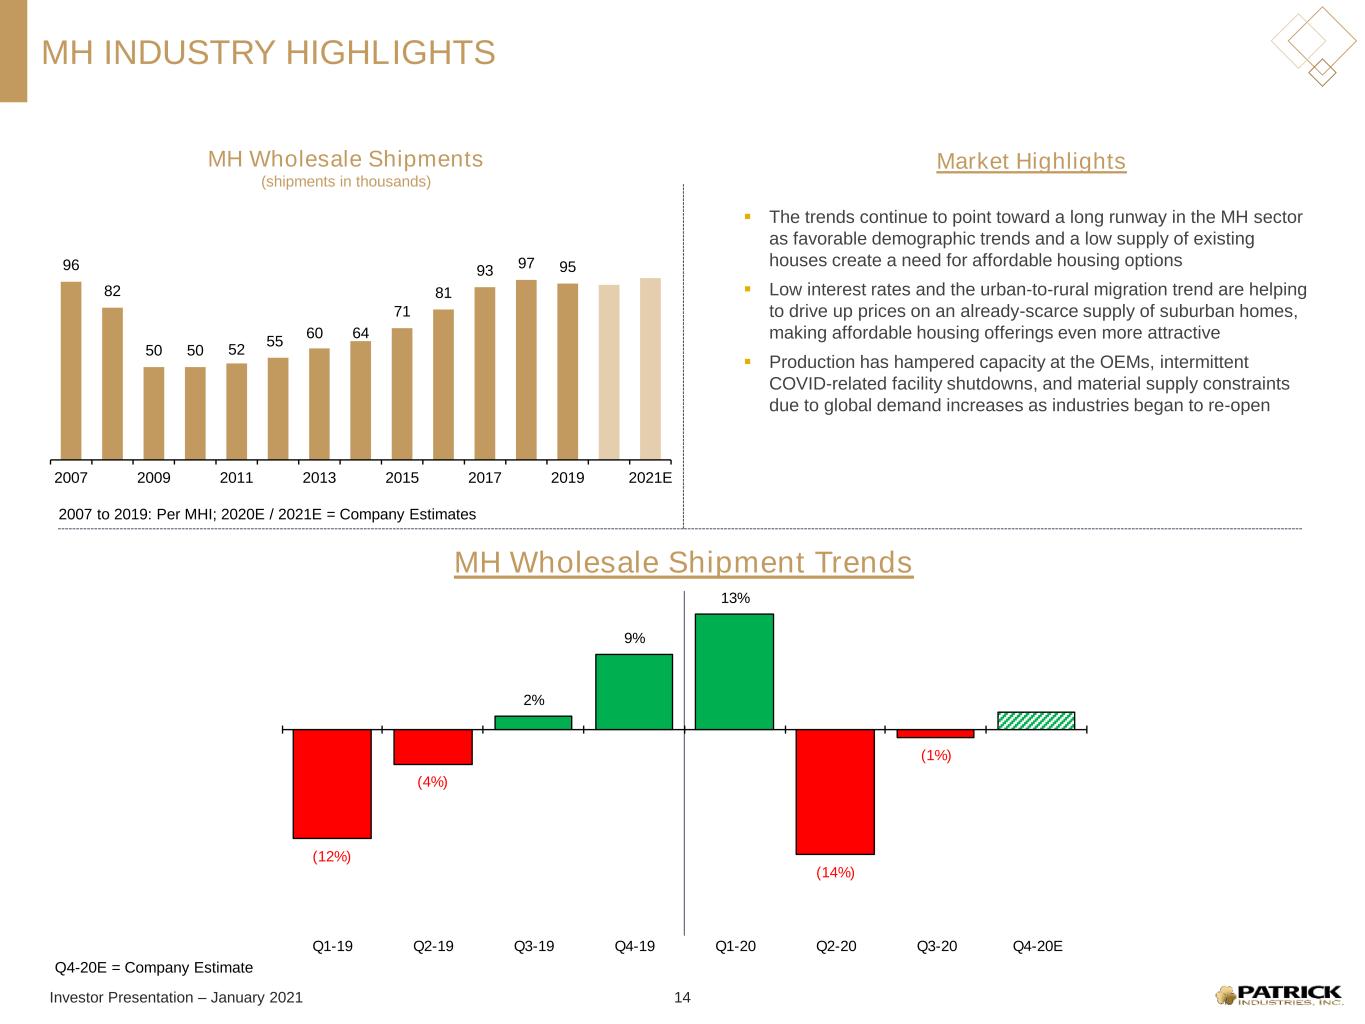
Investor Presentation – January 2021 MH INDUSTRY HIGHLIGHTS MH Wholesale Shipment Trends Market HighlightsMH Wholesale Shipments (shipments in thousands) The trends continue to point toward a long runway in the MH sector as favorable demographic trends and a low supply of existing houses create a need for affordable housing options Low interest rates and the urban-to-rural migration trend are helping to drive up prices on an already-scarce supply of suburban homes, making affordable housing offerings even more attractive Production has hampered capacity at the OEMs, intermittent COVID-related facility shutdowns, and material supply constraints due to global demand increases as industries began to re-open 96 82 50 50 52 55 60 64 71 81 93 97 95 2007 2009 2011 2013 2015 2017 2019 2021E 2007 to 2019: Per MHI; 2020E / 2021E = Company Estimates 14 (12%) (4%) 2% 9% 13% (14%) (1%) Q1-19 Q2-19 Q3-19 Q4-19 Q1-20 Q2-20 Q3-20 Q4-20E Q4-20E = Company Estimate
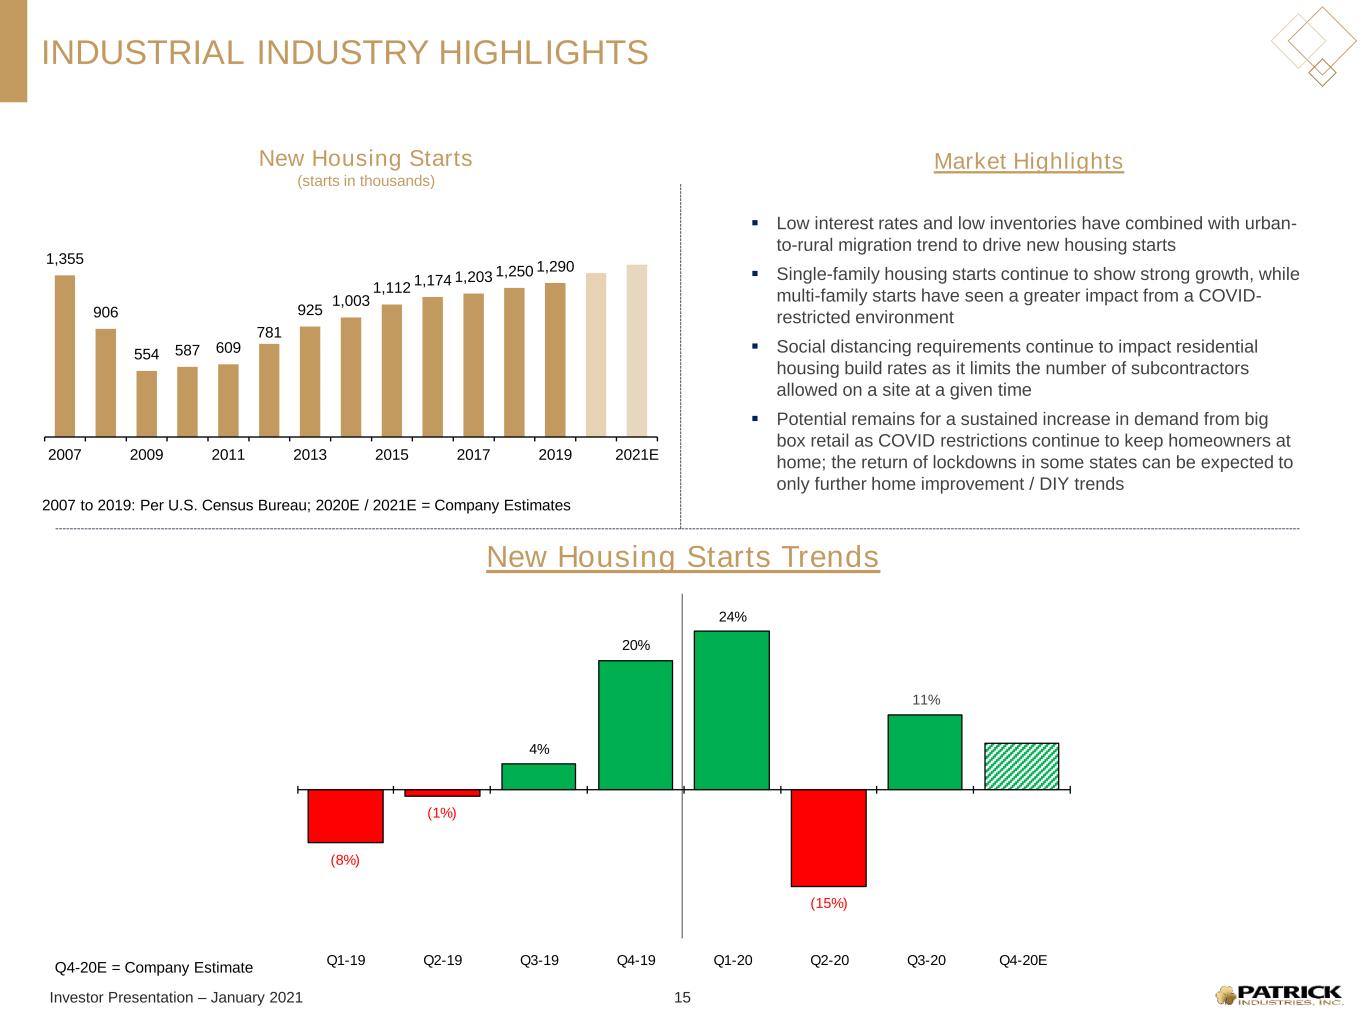
Investor Presentation – January 2021 INDUSTRIAL INDUSTRY HIGHLIGHTS New Housing Starts Trends Market HighlightsNew Housing Starts (starts in thousands) Low interest rates and low inventories have combined with urban- to-rural migration trend to drive new housing starts Single-family housing starts continue to show strong growth, while multi-family starts have seen a greater impact from a COVID- restricted environment Social distancing requirements continue to impact residential housing build rates as it limits the number of subcontractors allowed on a site at a given time Potential remains for a sustained increase in demand from big box retail as COVID restrictions continue to keep homeowners at home; the return of lockdowns in some states can be expected to only further home improvement / DIY trends 1,355 906 554 587 609 781 925 1,003 1,112 1,174 1,203 1,250 1,290 2007 2009 2011 2013 2015 2017 2019 2021E 2007 to 2019: Per U.S. Census Bureau; 2020E / 2021E = Company Estimates 15 (8%) (1%) 4% 20% 24% (15%) 11% Q1-19 Q2-19 Q3-19 Q4-19 Q1-20 Q2-20 Q3-20 Q4-20E Q4-20E = Company Estimate

Investor Presentation – January 2021 FINANCIAL OVERVIEW Growth Initiatives and Capital Allocation Strategy
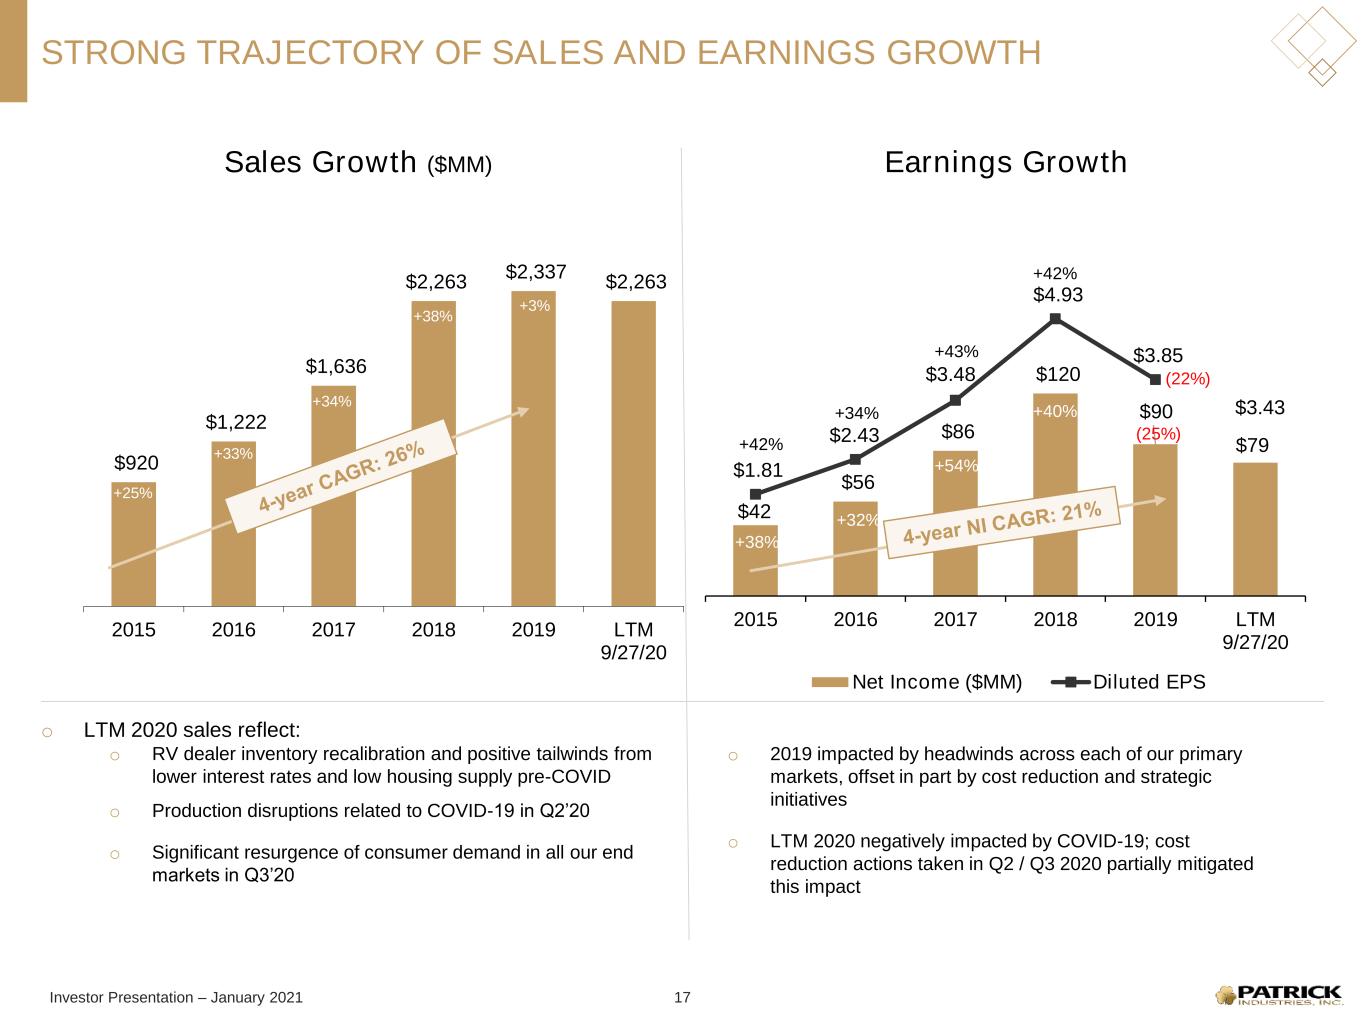
Investor Presentation – January 2021 STRONG TRAJECTORY OF SALES AND EARNINGS GROWTH o LTM 2020 sales reflect: o RV dealer inventory recalibration and positive tailwinds from lower interest rates and low housing supply pre-COVID o Production disruptions related to COVID-19 in Q2’20 o Significant resurgence of consumer demand in all our end markets in Q3’20 Sales Growth ($MM) Earnings Growth $920 $1,222 $1,636 $2,263 $2,337 $2,263 2015 2016 2017 2018 2019 LTM 9/27/20 +25% +33% +34% +38% +3% $42 $56 $86 $120 $90 $79 $1.81 $2.43 $3.48 $4.93 $3.85 $3.43 $- $1.0 0 $2.0 0 $3.0 0 $4.0 0 $5.0 0 $6.0 0 $- $20 $40 $60 $80 $10 0 $12 0 $14 0 $16 0 $18 0 $20 0 2015 2016 2017 2018 2019 LTM 9/27/20 Net Income ($MM) Diluted EPS +38% +32% +54% +40% (25%) +42% +34% +43% +42% (22%) 17 o 2019 impacted by headwinds across each of our primary markets, offset in part by cost reduction and strategic initiatives o LTM 2020 negatively impacted by COVID-19; cost reduction actions taken in Q2 / Q3 2020 partially mitigated this impact
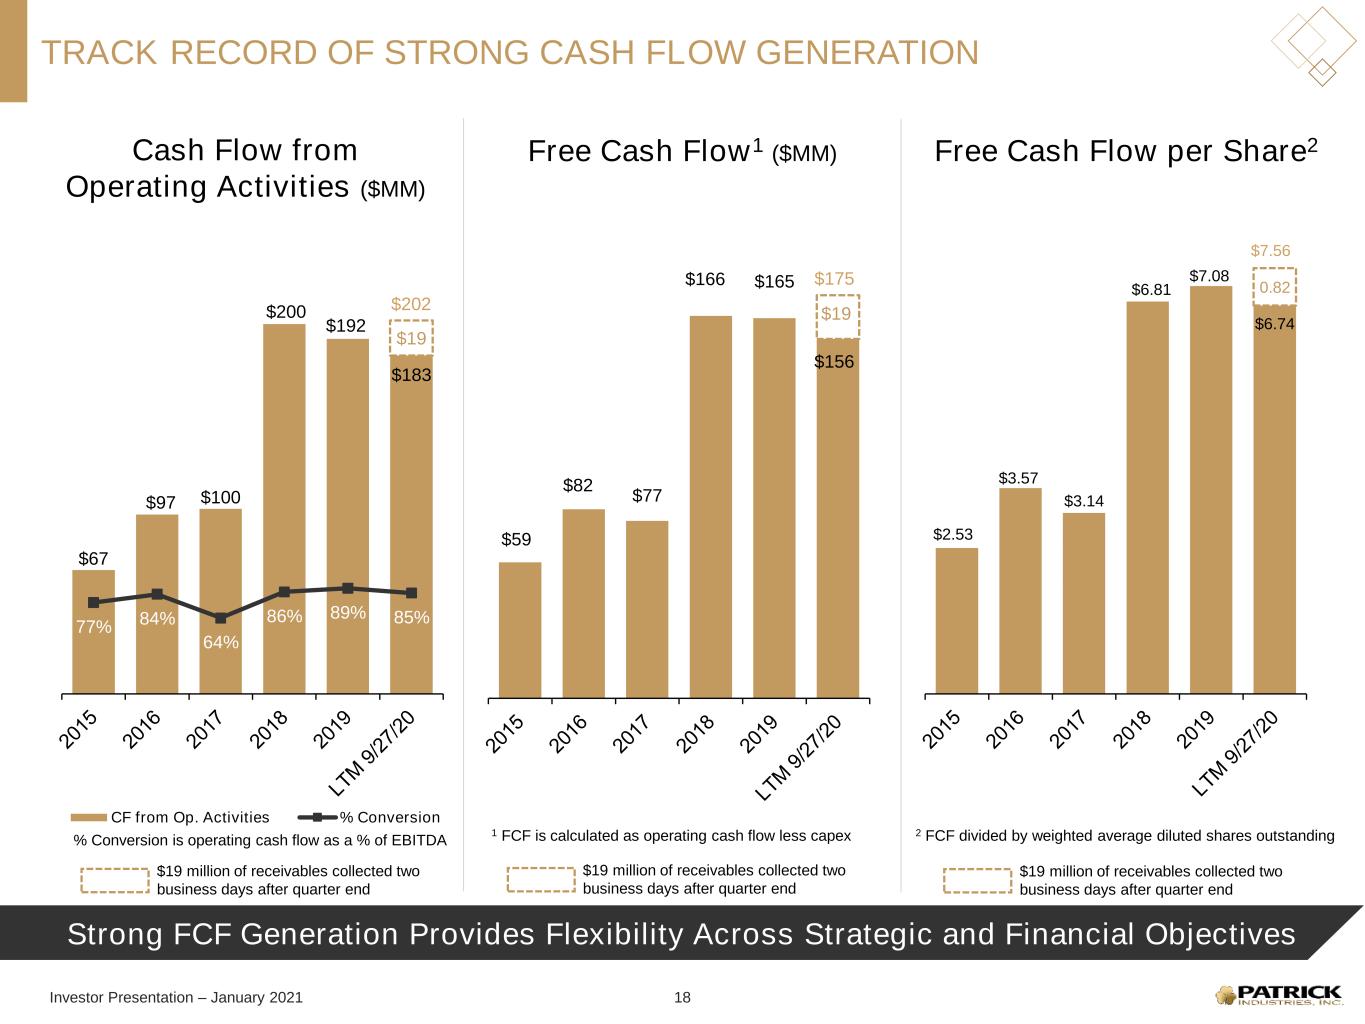
Investor Presentation – January 2021 Strong FCF Generation Provides Flexibility Across Strategic and Financial Objectives TRACK RECORD OF STRONG CASH FLOW GENERATION Cash Flow from Operating Activities ($MM) Free Cash Flow per Share2Free Cash Flow1 ($MM) $67 $97 $100 $200 $192 $183 $19 77% 84% 64% 86% 89% 85% 0% 50% 100 % 150 % 200 % 250 % 300 % 350 % $0 $50 $10 0 $15 0 $20 0 $25 0 CF from Op. Activities % Conversion $59 $82 $77 $166 $165 $156 $19 $0 $20 $40 $60 $80 $10 0 $12 0 $14 0 $16 0 $18 0 $20 0 $175 $2.53 $3.57 $3.14 $6.81 $7.08 $6.74 0.82 $0. 00 $1. 00 $2. 00 $3. 00 $4. 00 $5. 00 $6. 00 $7. 00 $8. 00 $7.56 1 FCF is calculated as operating cash flow less capex 2 FCF divided by weighted average diluted shares outstanding 18 % Conversion is operating cash flow as a % of EBITDA $19 million of receivables collected two business days after quarter end $19 million of receivables collected two business days after quarter end $19 million of receivables collected two business days after quarter end $202
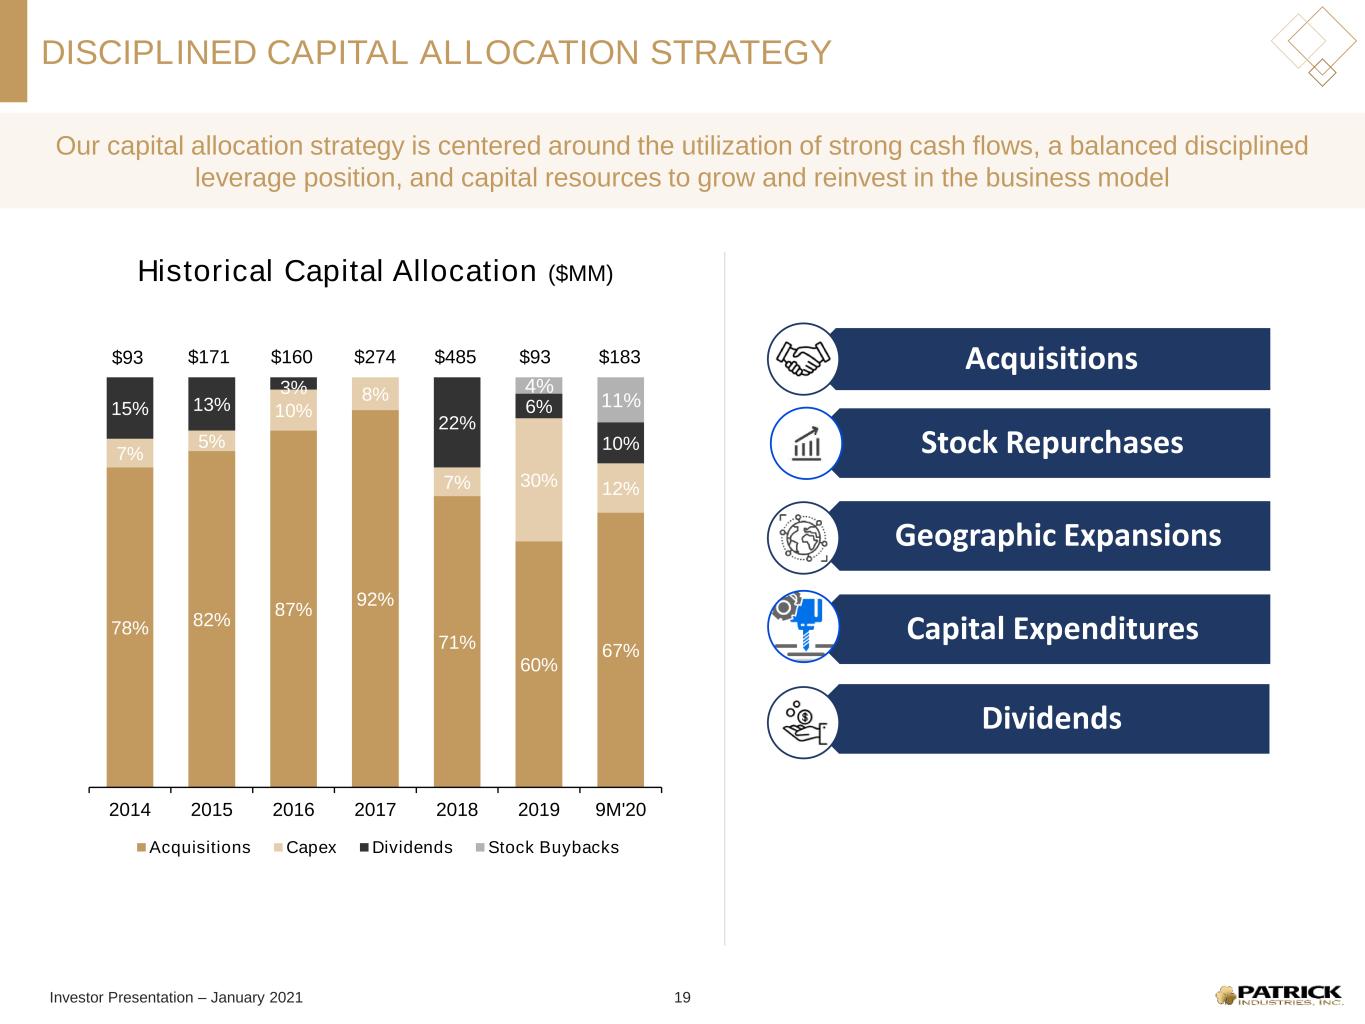
Investor Presentation – January 2021 DISCIPLINED CAPITAL ALLOCATION STRATEGY 78% 82% 87% 92% 71% 60% 67% 7% 5% 10% 8% 7% 30% 12% 15% 13% 3% 22% 6% 10% 4% 11% 2014 2015 2016 2017 2018 2019 9M'20 Acquisitions Capex Dividends Stock Buybacks Our capital allocation strategy is centered around the utilization of strong cash flows, a balanced disciplined leverage position, and capital resources to grow and reinvest in the business model Historical Capital Allocation ($MM) $93 $171 $160 $274 $485 $183 19 $93 Acquisitions Stock Repurchases Geographic Expansions Capital Expenditures Dividends
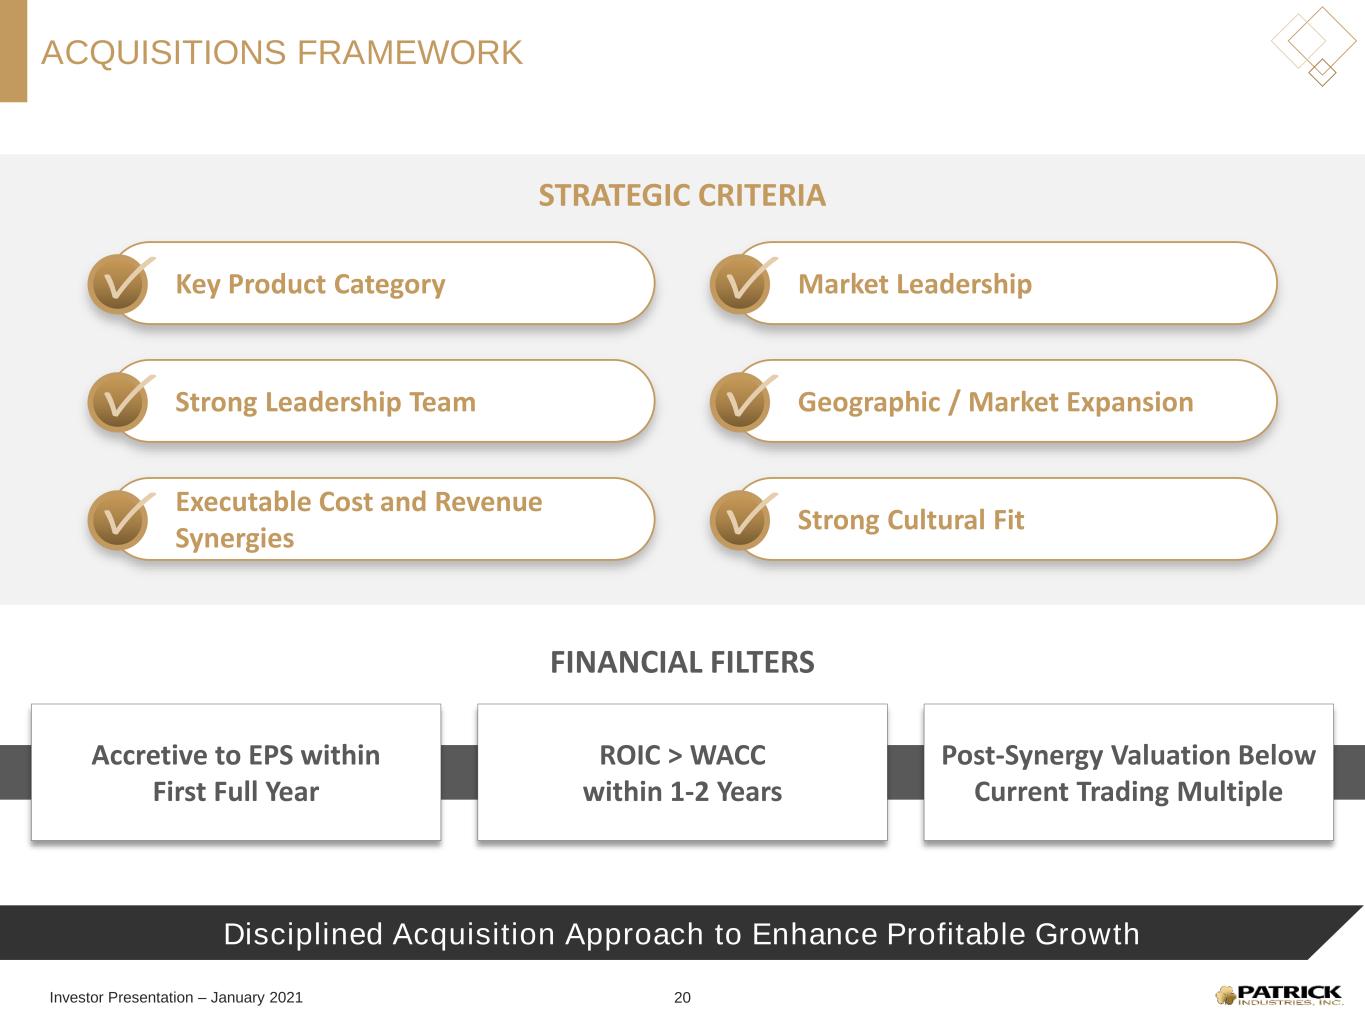
Investor Presentation – January 2021 Disciplined Acquisition Approach to Enhance Profitable Growth ACQUISITIONS FRAMEWORK 20 Accretive to EPS within First Full Year ROIC > WACC within 1-2 Years Post-Synergy Valuation Below Current Trading Multiple FINANCIAL FILTERS STRATEGIC CRITERIA Key Product Category Market Leadership Strong Leadership Team Geographic / Market Expansion Executable Cost and Revenue Synergies Strong Cultural Fit
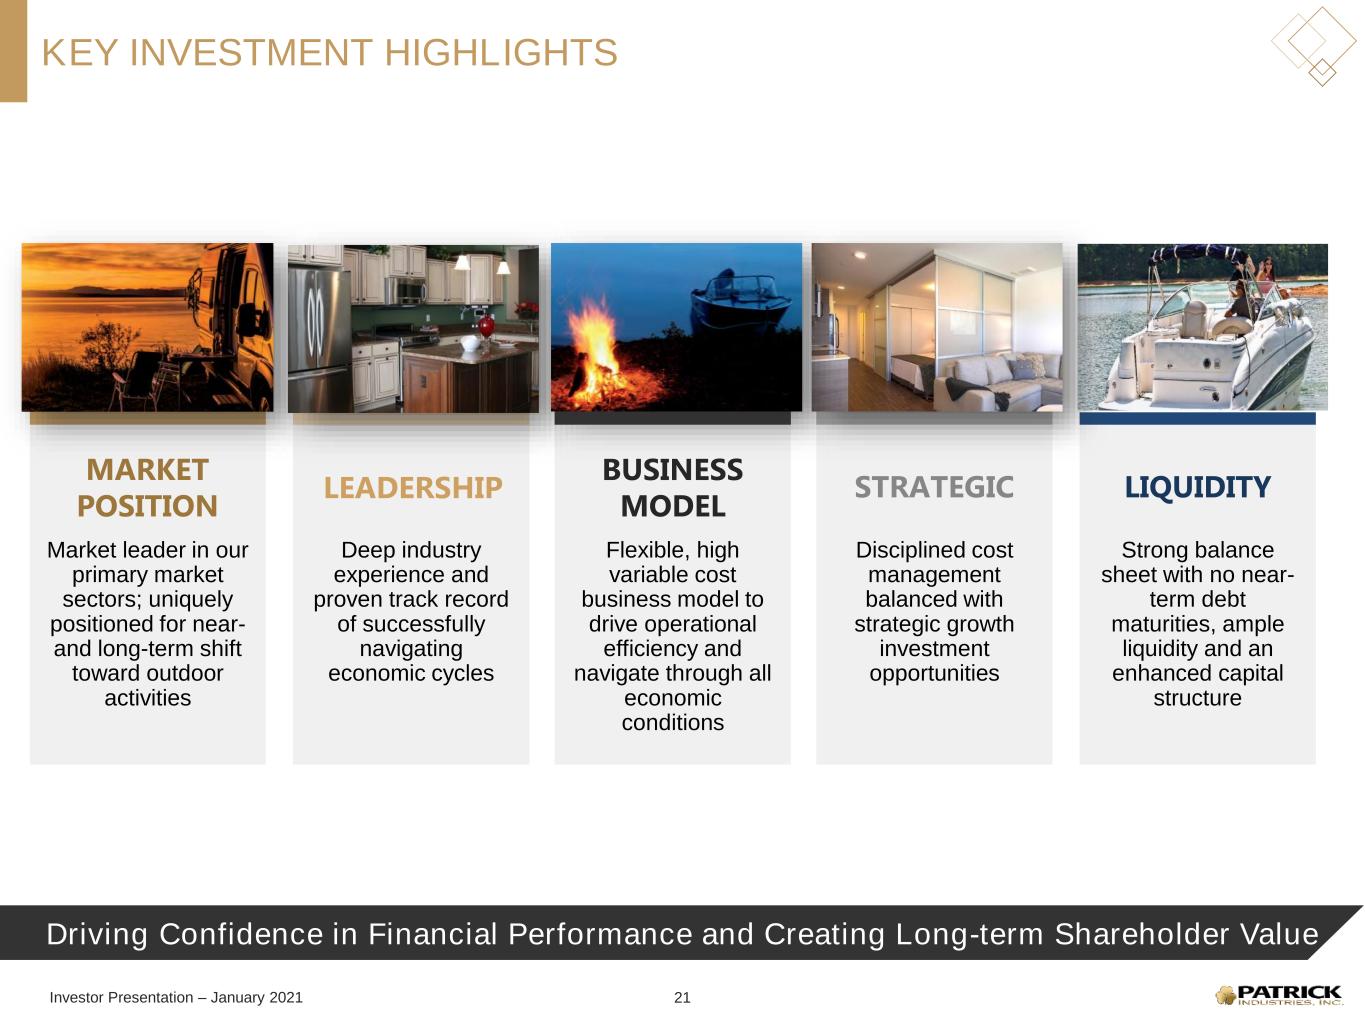
Investor Presentation – January 2021 MARKET POSITION Market leader in our primary market sectors; uniquely positioned for near- and long-term shift toward outdoor activities BUSINESS MODEL Flexible, high variable cost business model to drive operational efficiency and navigate through all economic conditions LEADERSHIP Deep industry experience and proven track record of successfully navigating economic cycles LIQUIDITY Strong balance sheet with no near- term debt maturities, ample liquidity and an enhanced capital structure STRATEGIC Disciplined cost management balanced with strategic growth investment opportunities Driving Confidence in Financial Performance and Creating Long-term Shareholder Value KEY INVESTMENT HIGHLIGHTS 21

Investor Presentation – January 2021 APPENDIX
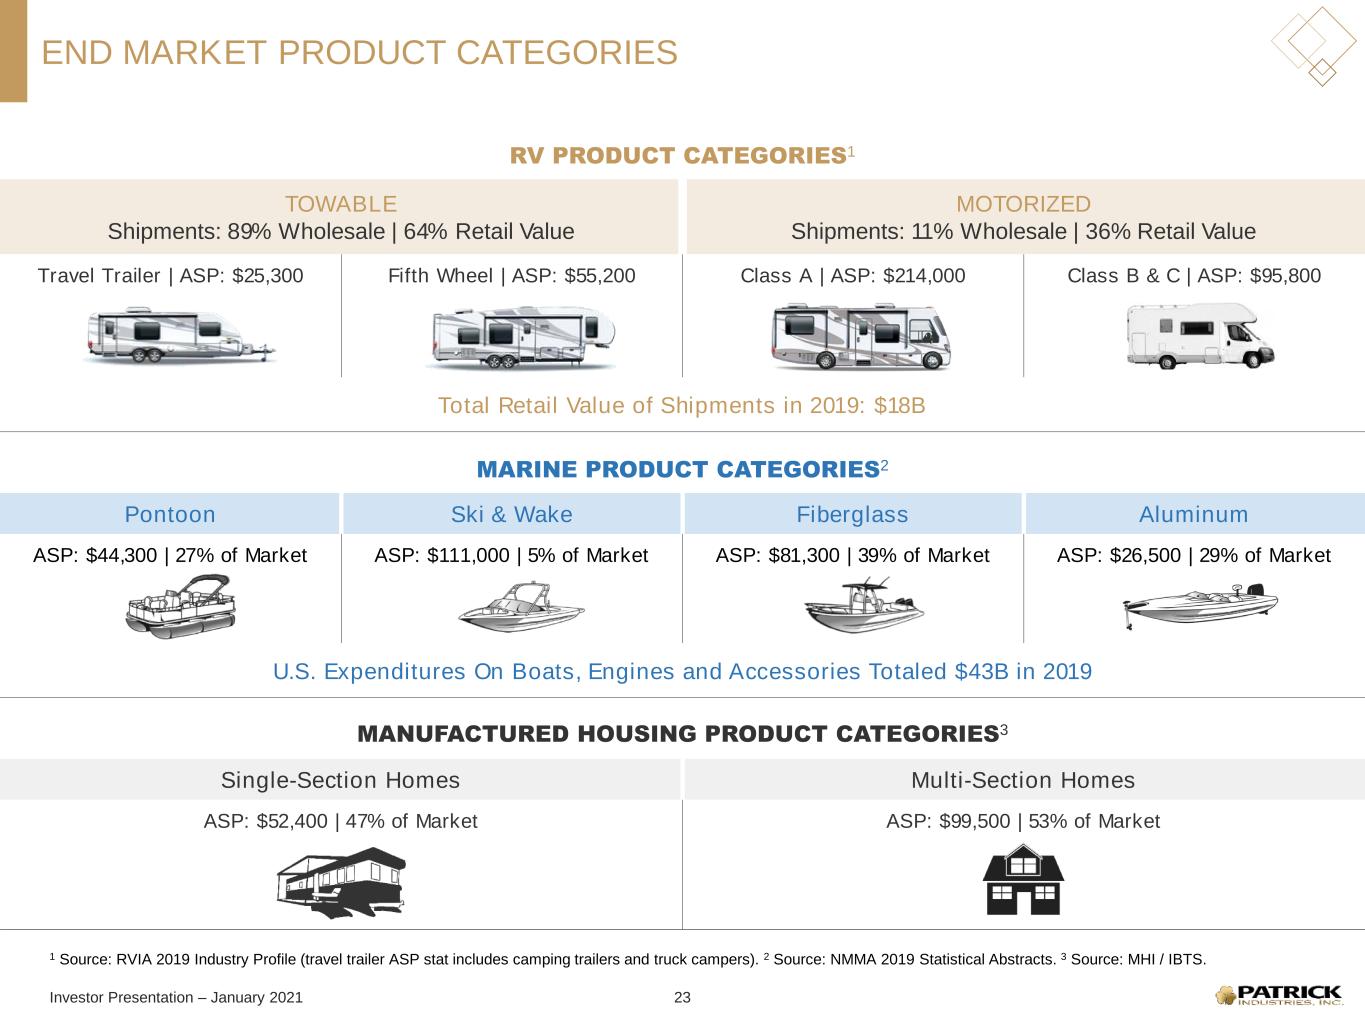
Investor Presentation – January 2021 END MARKET PRODUCT CATEGORIES TOWABLE Shipments: 89% Wholesale | 64% Retail Value MOTORIZED Shipments: 11% Wholesale | 36% Retail Value Travel Trailer | ASP: $25,300 Fifth Wheel | ASP: $55,200 Class A | ASP: $214,000 Class B & C | ASP: $95,800 Total Retail Value of Shipments in 2019: $18B RV PRODUCT CATEGORIES1 Pontoon Ski & Wake Fiberglass Aluminum ASP: $44,300 | 27% of Market ASP: $111,000 | 5% of Market ASP: $81,300 | 39% of Market ASP: $26,500 | 29% of Market U.S. Expenditures On Boats, Engines and Accessories Totaled $43B in 2019 MARINE PRODUCT CATEGORIES2 Single-Section Homes Multi-Section Homes ASP: $52,400 | 47% of Market ASP: $99,500 | 53% of Market MANUFACTURED HOUSING PRODUCT CATEGORIES3 23 1 Source: RVIA 2019 Industry Profile (travel trailer ASP stat includes camping trailers and truck campers). 2 Source: NMMA 2019 Statistical Abstracts. 3 Source: MHI / IBTS.
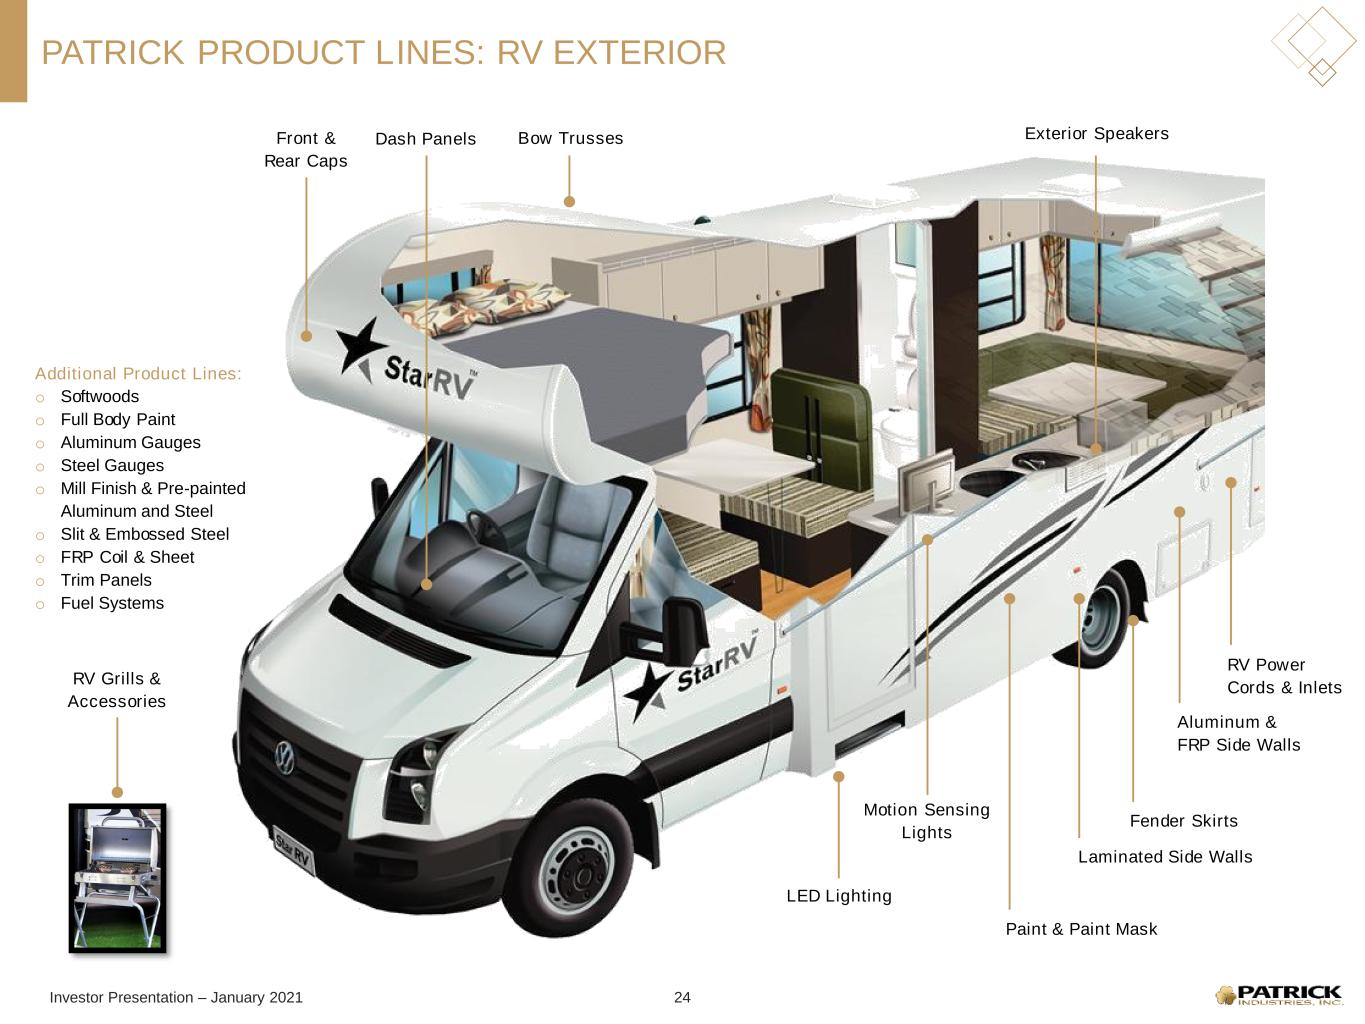
Investor Presentation – January 2021 PATRICK PRODUCT LINES: RV EXTERIOR Exterior Speakers Paint & Paint Mask LED Lighting Aluminum & FRP Side Walls Laminated Side Walls Motion Sensing Lights RV Grills & Accessories Front & Rear Caps Bow TrussesDash Panels Fender Skirts RV Power Cords & Inlets Additional Product Lines: o Softwoods o Full Body Paint o Aluminum Gauges o Steel Gauges o Mill Finish & Pre-painted Aluminum and Steel o Slit & Embossed Steel o FRP Coil & Sheet o Trim Panels o Fuel Systems 24
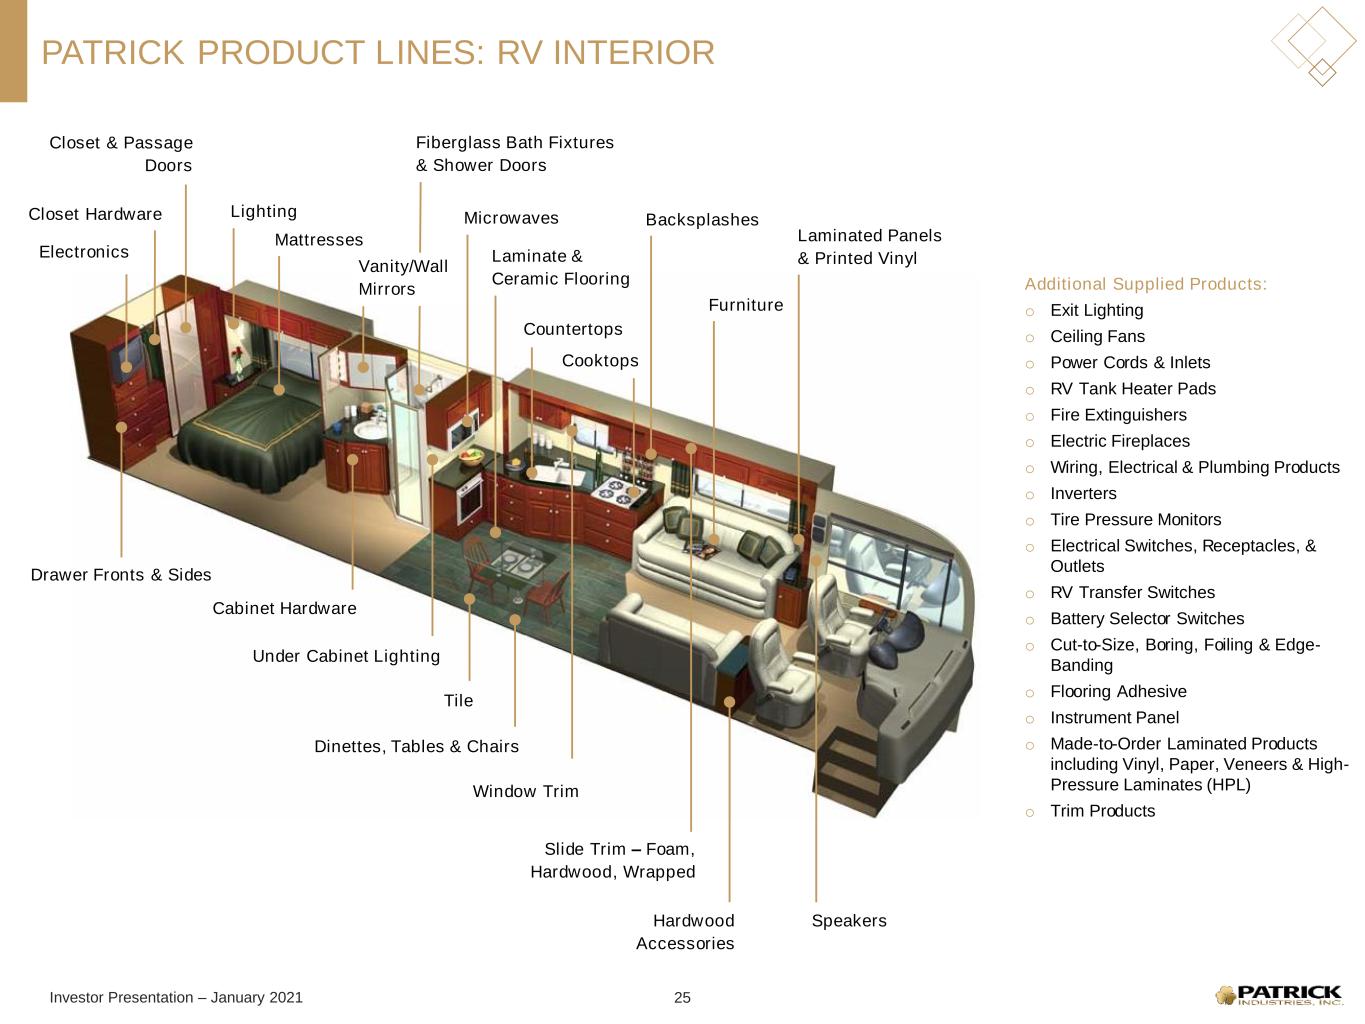
Investor Presentation – January 2021 PATRICK PRODUCT LINES: RV INTERIOR Additional Supplied Products: o Exit Lighting o Ceiling Fans o Power Cords & Inlets o RV Tank Heater Pads o Fire Extinguishers o Electric Fireplaces o Wiring, Electrical & Plumbing Products o Inverters o Tire Pressure Monitors o Electrical Switches, Receptacles, & Outlets o RV Transfer Switches o Battery Selector Switches o Cut-to-Size, Boring, Foiling & Edge- Banding o Flooring Adhesive o Instrument Panel o Made-to-Order Laminated Products including Vinyl, Paper, Veneers & High- Pressure Laminates (HPL) o Trim Products Hardwood Accessories Window Trim Slide Trim – Foam, Hardwood, Wrapped Under Cabinet Lighting Tile Cabinet Hardware Dinettes, Tables & Chairs Drawer Fronts & Sides Speakers Electronics Closet Hardware Closet & Passage Doors Lighting Mattresses Fiberglass Bath Fixtures & Shower Doors Vanity/Wall Mirrors Microwaves Laminate & Ceramic Flooring Countertops Backsplashes Cooktops Furniture Laminated Panels & Printed Vinyl 25
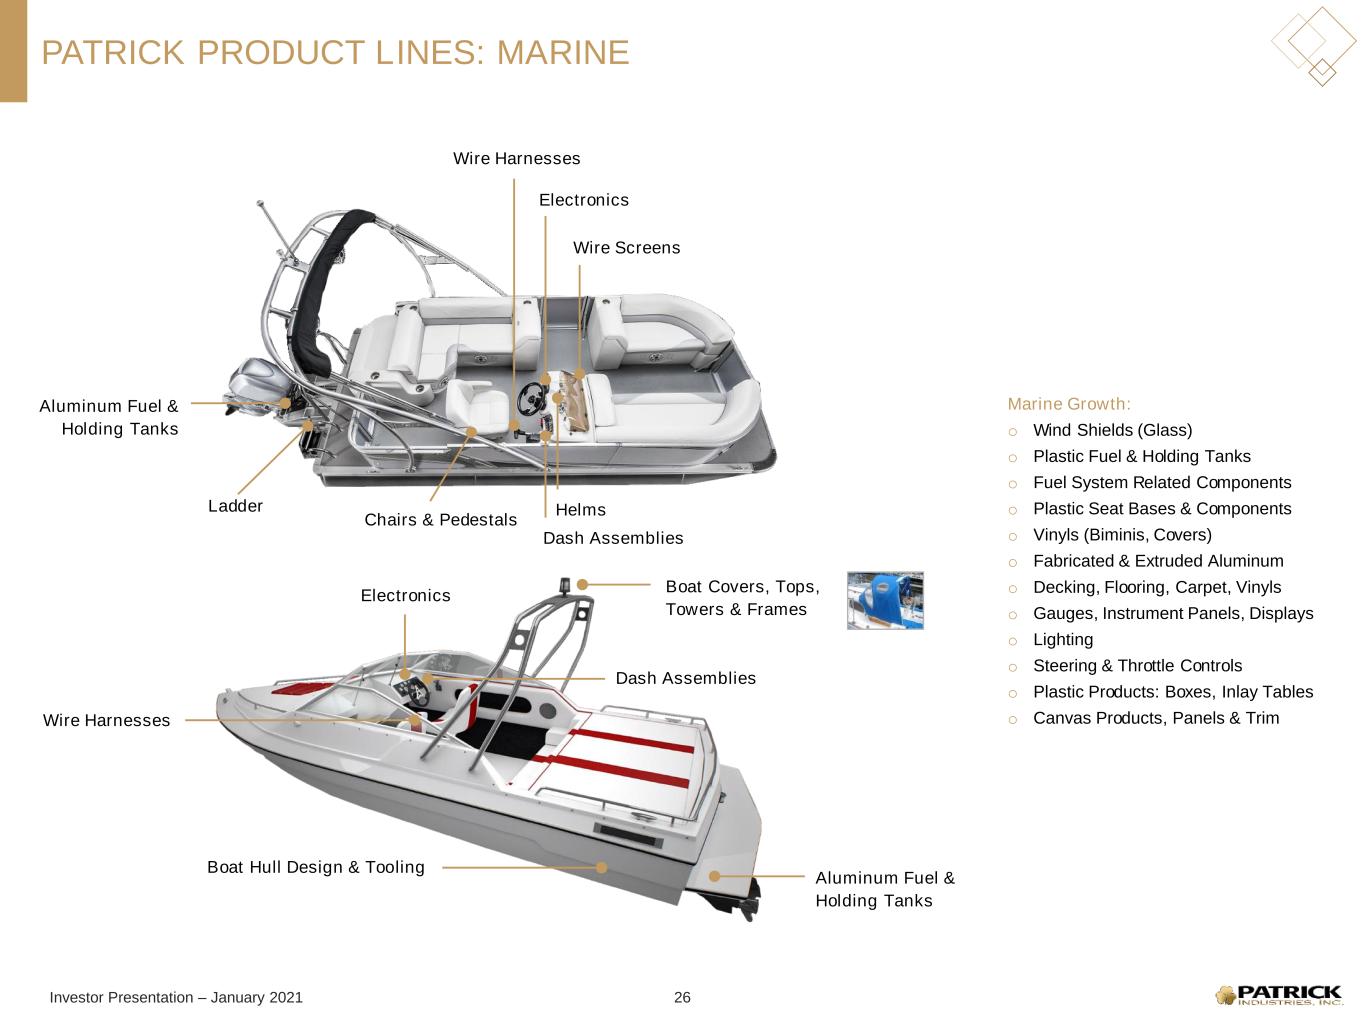
Investor Presentation – January 2021 PATRICK PRODUCT LINES: MARINE Aluminum Fuel & Holding Tanks Wire Harnesses Electronics Dash Assemblies Wire Screens Helms Aluminum Fuel & Holding Tanks Boat Hull Design & Tooling Wire Harnesses Dash Assemblies Electronics Boat Covers, Tops, Towers & Frames Marine Growth: o Wind Shields (Glass) o Plastic Fuel & Holding Tanks o Fuel System Related Components o Plastic Seat Bases & Components o Vinyls (Biminis, Covers) o Fabricated & Extruded Aluminum o Decking, Flooring, Carpet, Vinyls o Gauges, Instrument Panels, Displays o Lighting o Steering & Throttle Controls o Plastic Products: Boxes, Inlay Tables o Canvas Products, Panels & Trim 26 Ladder Chairs & Pedestals
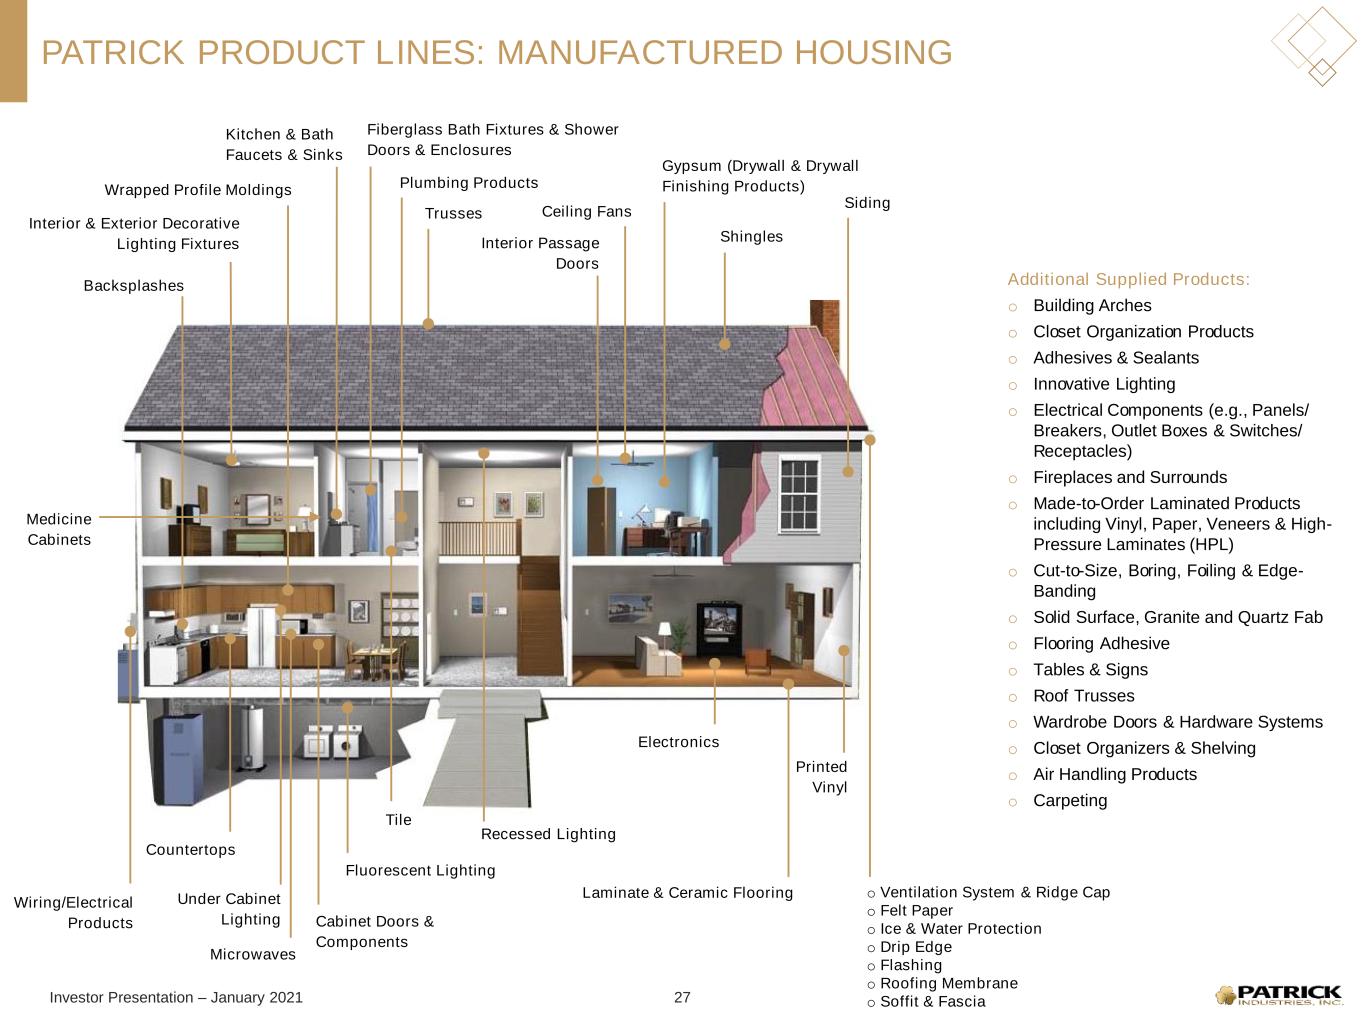
Investor Presentation – January 2021 PATRICK PRODUCT LINES: MANUFACTURED HOUSING Interior Passage Doors Kitchen & Bath Faucets & Sinks Gypsum (Drywall & Drywall Finishing Products) Laminate & Ceramic Flooring Fiberglass Bath Fixtures & Shower Doors & Enclosures Cabinet Doors & Components Microwaves Countertops Electronics Siding Shingles o Ventilation System & Ridge Cap o Felt Paper o Ice & Water Protection o Drip Edge o Flashing o Roofing Membrane o Soffit & Fascia Wrapped Profile Moldings Plumbing Products Backsplashes Recessed Lighting Fluorescent Lighting Wiring/Electrical Products Ceiling Fans Medicine Cabinets Under Cabinet Lighting Tile Printed Vinyl Trusses Interior & Exterior Decorative Lighting Fixtures Additional Supplied Products: o Building Arches o Closet Organization Products o Adhesives & Sealants o Innovative Lighting o Electrical Components (e.g., Panels/ Breakers, Outlet Boxes & Switches/ Receptacles) o Fireplaces and Surrounds o Made-to-Order Laminated Products including Vinyl, Paper, Veneers & High- Pressure Laminates (HPL) o Cut-to-Size, Boring, Foiling & Edge- Banding o Solid Surface, Granite and Quartz Fab o Flooring Adhesive o Tables & Signs o Roof Trusses o Wardrobe Doors & Hardware Systems o Closet Organizers & Shelving o Air Handling Products o Carpeting 27
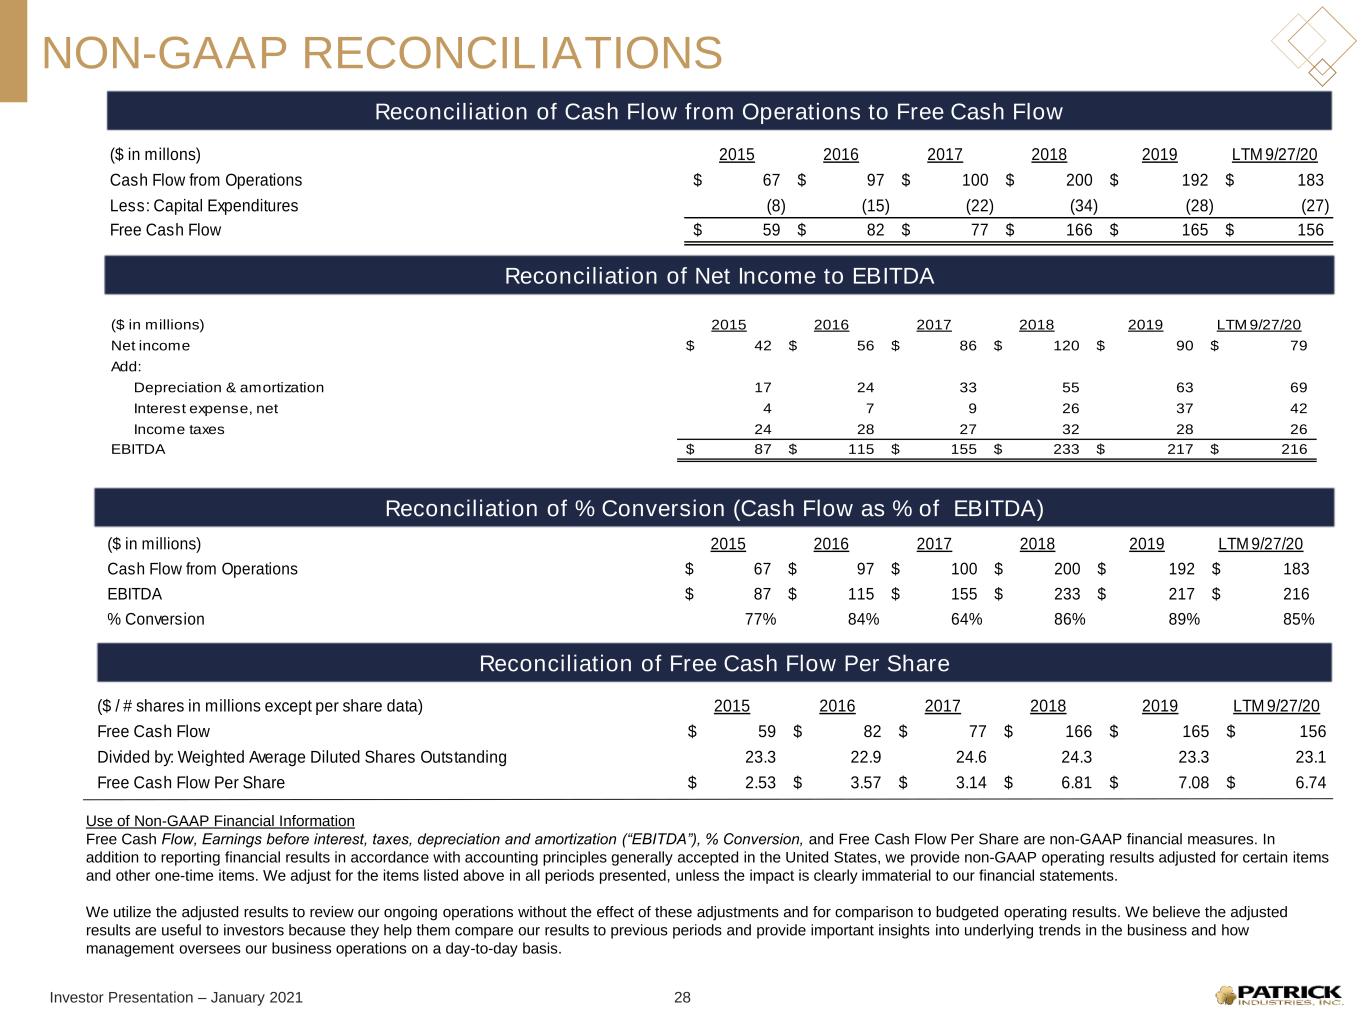
Investor Presentation – January 2021 NON-GAAP RECONCILIATIONS Reconciliation of Cash Flow from Operations to Free Cash Flow Reconciliation of Free Cash Flow Per Share Use of Non-GAAP Financial Information Free Cash Flow, Earnings before interest, taxes, depreciation and amortization (“EBITDA”), % Conversion, and Free Cash Flow Per Share are non-GAAP financial measures. In addition to reporting financial results in accordance with accounting principles generally accepted in the United States, we provide non-GAAP operating results adjusted for certain items and other one-time items. We adjust for the items listed above in all periods presented, unless the impact is clearly immaterial to our financial statements. We utilize the adjusted results to review our ongoing operations without the effect of these adjustments and for comparison to budgeted operating results. We believe the adjusted results are useful to investors because they help them compare our results to previous periods and provide important insights into underlying trends in the business and how management oversees our business operations on a day-to-day basis. Reconciliation of % Conversion (Cash Flow as % of EBITDA) Reconciliation of Net Income to EBITDA 28 ($ in millons) 2015 2016 2017 2018 2019 LTM 9/27/20 Cash Flow from Operations 67$ 97$ 100$ 200$ 192$ 183$ Less: Capital Expenditures (8) (15) (22) (34) (28) (27) Free Cash Flow 59$ 82$ 77$ 166$ 165$ 156$ ($ / # shares in millions except per share data) 2015 2016 2017 2018 2019 LTM 9/27/20 Free Cash Flow 59$ 82$ 77$ 166$ 165$ 156$ Divided by: Weighted Average Diluted Shares Outstanding 23.3 22.9 24.6 24.3 23.3 23.1 Free Cash Flow Per Share 2.53$ 3.57$ 3.14$ 6.81$ 7.08$ 6.74$ ($ in millions) 2015 2016 2017 2018 2019 LTM 9/27/20 Net income 42$ 56$ 86$ 120$ 90$ 79$ Add: Depreciation & amortization 17 24 33 55 63 69 Interest expense, net 4 7 9 26 37 42 Income taxes 24 28 27 32 28 26 EBITDA 87$ 115$ 155$ 233$ 217$ 216$ ($ in millions) 2015 2016 2017 2018 2019 LTM 9/27/20 Cash Flow from Operations 67$ 97$ 100$ 200$ 192$ 183$ EBITDA 87$ 115$ 155$ 233$ 217$ 216$ % Conversion 77% 84% 64% 86% 89% 85%