EX-99.2
Published on October 27, 2022

Q3 2022 Earnings Presentation 1 Q3 2022 Earnings Presentation October 27, 2022
Q3 2022 Earnings Presentation 2 Forward Looking Statements This presentation contains certain statements related to future results, our intentions, beliefs and expectations or predictions for the future which are forward-looking statements as that term is defined in the Private Securities Litigation Reform Act of 1995. These forward-looking statements involve a number of risks and uncertainties that could cause actual results to differ materially from either historical or anticipated results depending on a variety of factors. These risks and uncertainties include, but are not limited to, the impact of the continuing financial and operational uncertainty due to the COVID-19 pandemic, including its impact on the overall economy, our sales, customers, operations, team members and suppliers. Further information concerning the Company and its business, including factors that potentially could materially affect the Company’s financial results, is contained in the Company’s filings with the Securities and Exchange Commission. This presentation includes market and industry data, forecasts and valuations that have been obtained from independent consultant reports, publicly available information, various industry publications and other published industry sources. Although we believe these sources are reliable, we have not independently verified the information and cannot make any representation as to the accuracy or completeness of such information. We disclaim any obligation or undertaking to disseminate any updates or revisions to any forward-looking statements contained in this presentation or to reflect any change in our expectations after the date of this presentation or any change in events, conditions or circumstances on which any statement is based. Use of Non-GAAP Financial Measures This presentation contains non-GAAP financial measures. These measures, the purposes for which management uses them, why management believes they are useful to investors, and a reconciliation to the most directly comparable GAAP financial measures can be found in the Appendix of this presentation. All references to profit measures and earnings per share on a comparable basis exclude items that affect comparability.
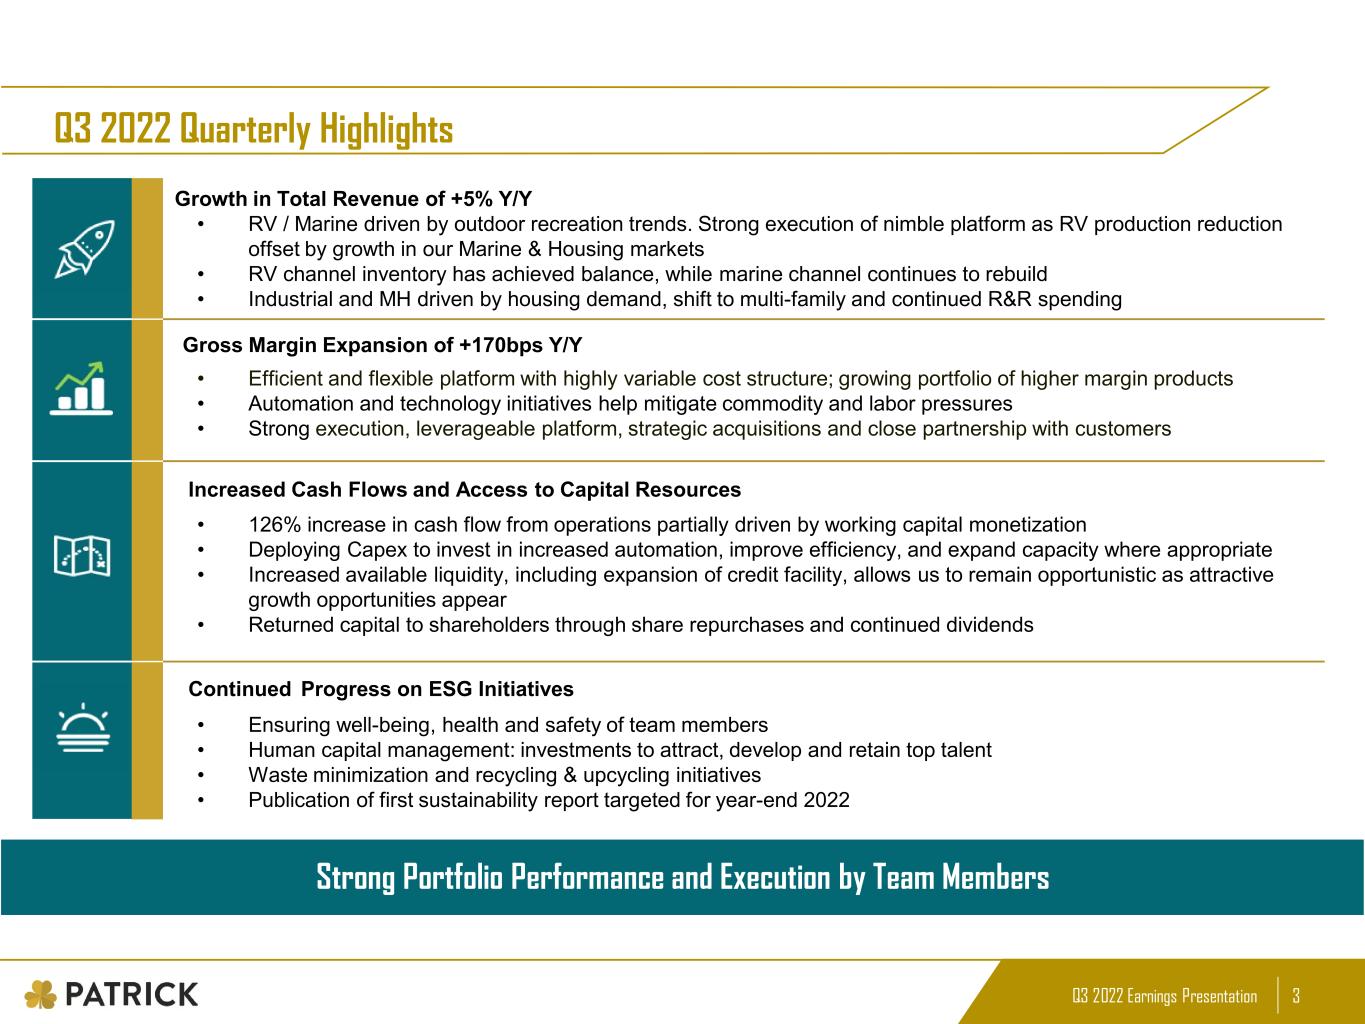
Q3 2022 Earnings Presentation 3 Q3 2022 Quarterly Highlights Strong Portfolio Performance and Execution by Team Members Growth in Total Revenue of +5% Y/Y • RV / Marine driven by outdoor recreation trends. Strong execution of nimble platform as RV production reduction offset by growth in our Marine & Housing markets • RV channel inventory has achieved balance, while marine channel continues to rebuild • Industrial and MH driven by housing demand, shift to multi-family and continued R&R spending • Efficient and flexible platform with highly variable cost structure; growing portfolio of higher margin products • Automation and technology initiatives help mitigate commodity and labor pressures • Strong execution, leverageable platform, strategic acquisitions and close partnership with customers Increased Cash Flows and Access to Capital Resources • 126% increase in cash flow from operations partially driven by working capital monetization • Deploying Capex to invest in increased automation, improve efficiency, and expand capacity where appropriate • Increased available liquidity, including expansion of credit facility, allows us to remain opportunistic as attractive growth opportunities appear • Returned capital to shareholders through share repurchases and continued dividends Continued Progress on ESG Initiatives • Ensuring well-being, health and safety of team members • Human capital management: investments to attract, develop and retain top talent • Waste minimization and recycling & upcycling initiatives • Publication of first sustainability report targeted for year-end 2022 Gross Margin Expansion of +170bps Y/Y Increased Cash Flows and Access to Capital Resources Continued Progress on ESG Initiatives
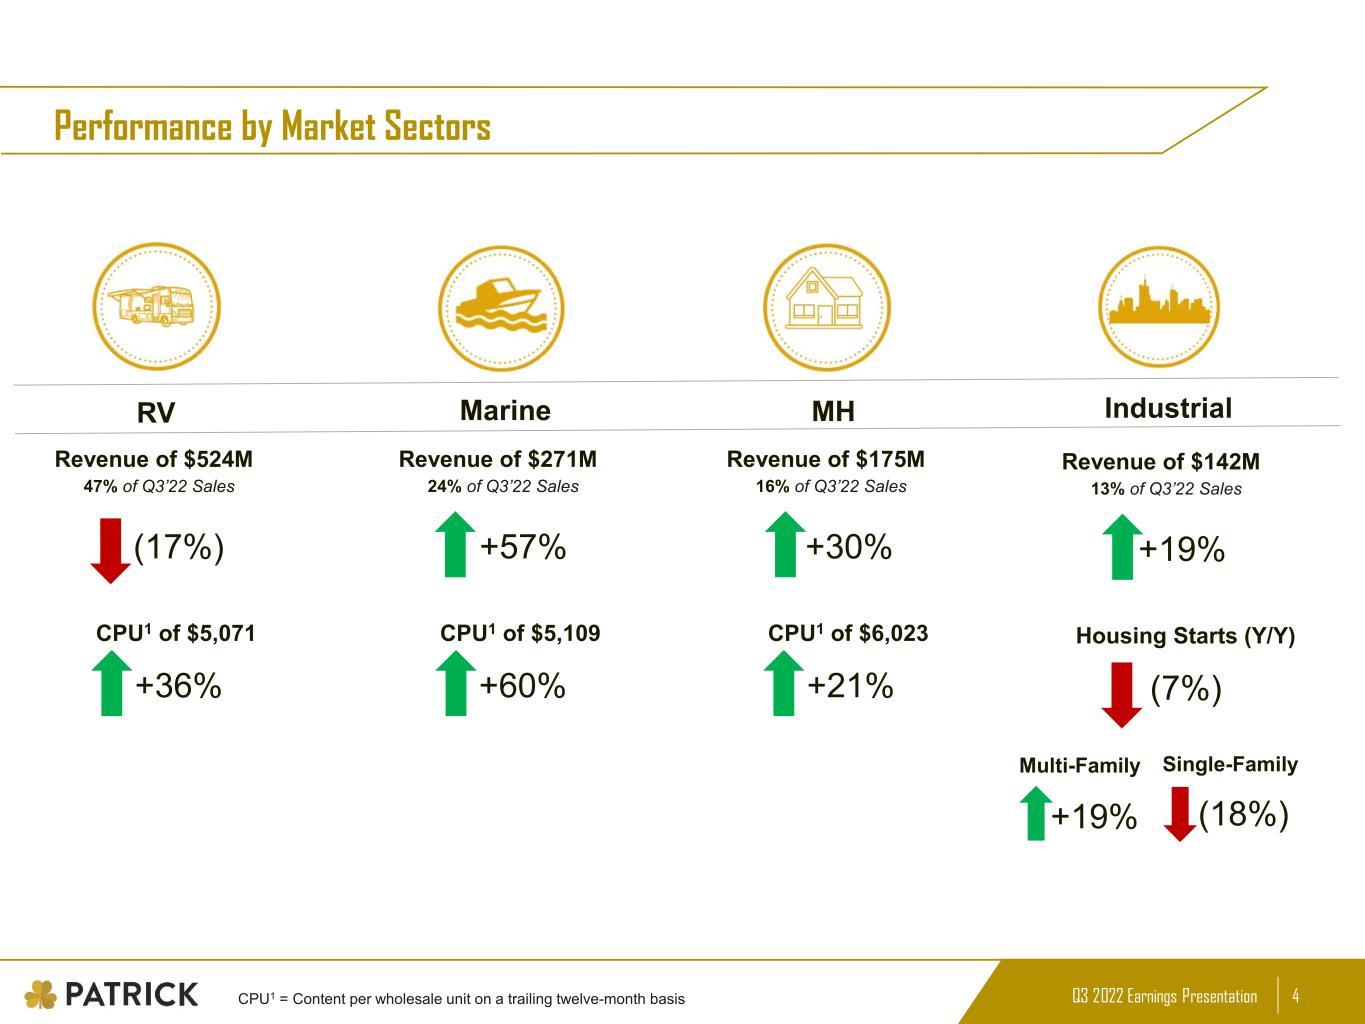
Q3 2022 Earnings Presentation 4 Performance by Market Sectors RV Marine MH Industrial 47% of Q3’22 Sales 24% of Q3’22 Sales 16% of Q3’22 Sales 13% of Q3’22 Sales (17%) +57% +30% +19% Revenue of $524M Revenue of $271M Revenue of $175M Revenue of $142M CPU1 of $5,071 +36% CPU1 of $5,109 +60% CPU1 of $6,023 +21% Housing Starts (Y/Y) (7%) CPU1 = Content per wholesale unit on a trailing twelve-month basis Multi-Family Single-Family (18%)+19%
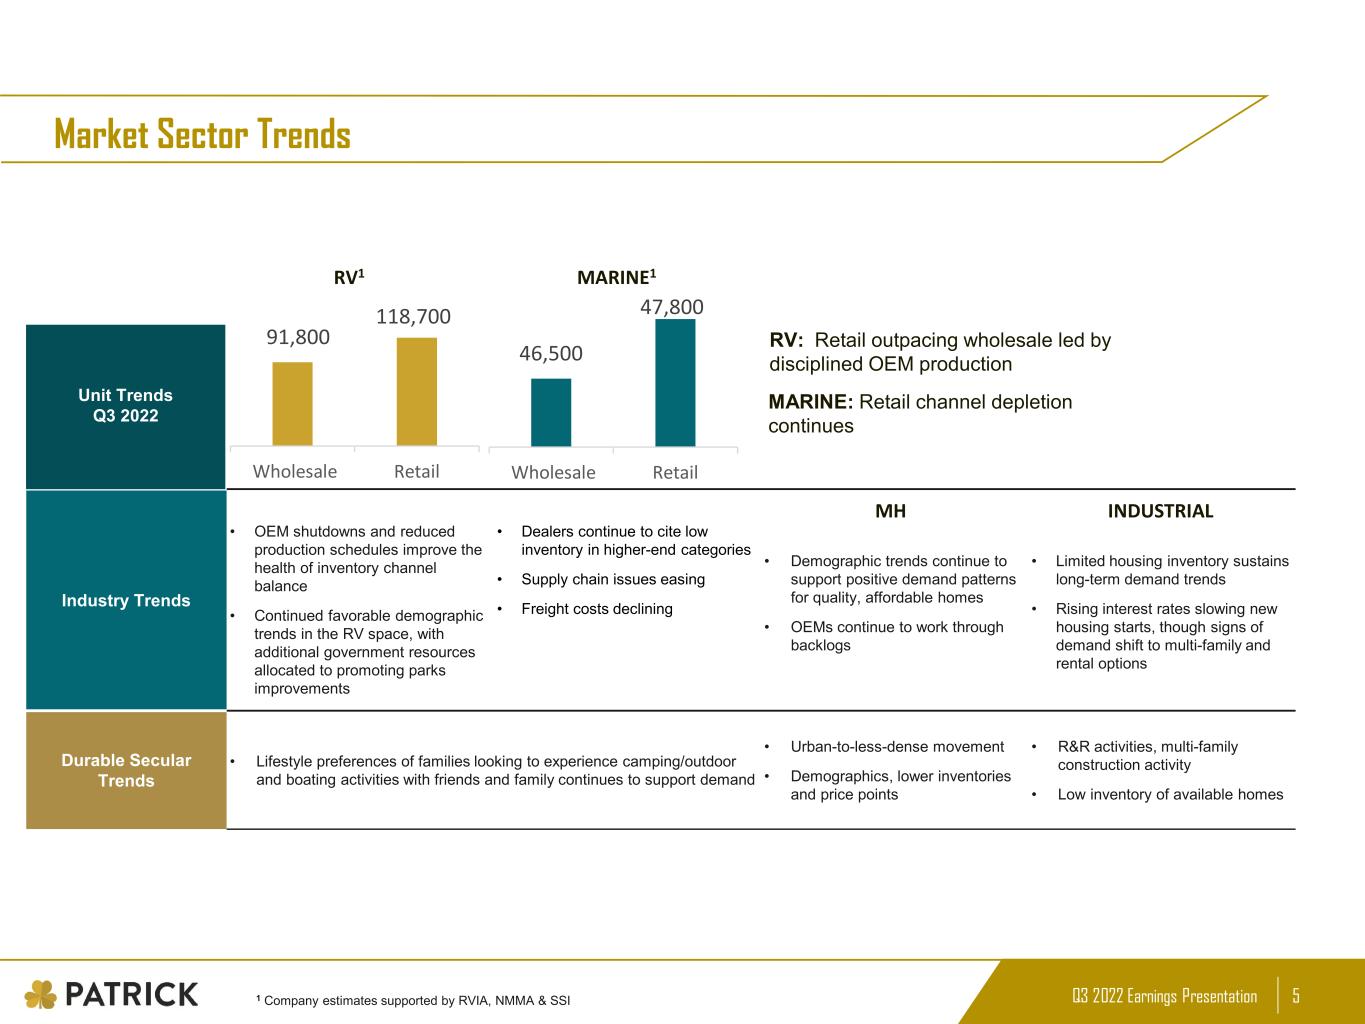
Q3 2022 Earnings Presentation 5 Market Sector Trends Industry Trends • OEM shutdowns and reduced production schedules improve the health of inventory channel balance • Continued favorable demographic trends in the RV space, with additional government resources allocated to promoting parks improvements • Dealers continue to cite low inventory in higher-end categories • Supply chain issues easing • Freight costs declining • Demographic trends continue to support positive demand patterns for quality, affordable homes • OEMs continue to work through backlogs • Limited housing inventory sustains long-term demand trends • Rising interest rates slowing new housing starts, though signs of demand shift to multi-family and rental options Durable Secular Trends • Lifestyle preferences of families looking to experience camping/outdoor and boating activities with friends and family continues to support demand • Urban-to-less-dense movement • Demographics, lower inventories and price points • R&R activities, multi-family construction activity • Low inventory of available homes Unit Trends Q3 2022 RV1 MARINE1 MH INDUSTRIAL RV: Retail outpacing wholesale led by disciplined OEM production MARINE: Retail channel depletion continues 1 Company estimates supported by RVIA, NMMA & SSI 91,800 118,700 Wholesale Retail 46,500 47,800 Wholesale Retail
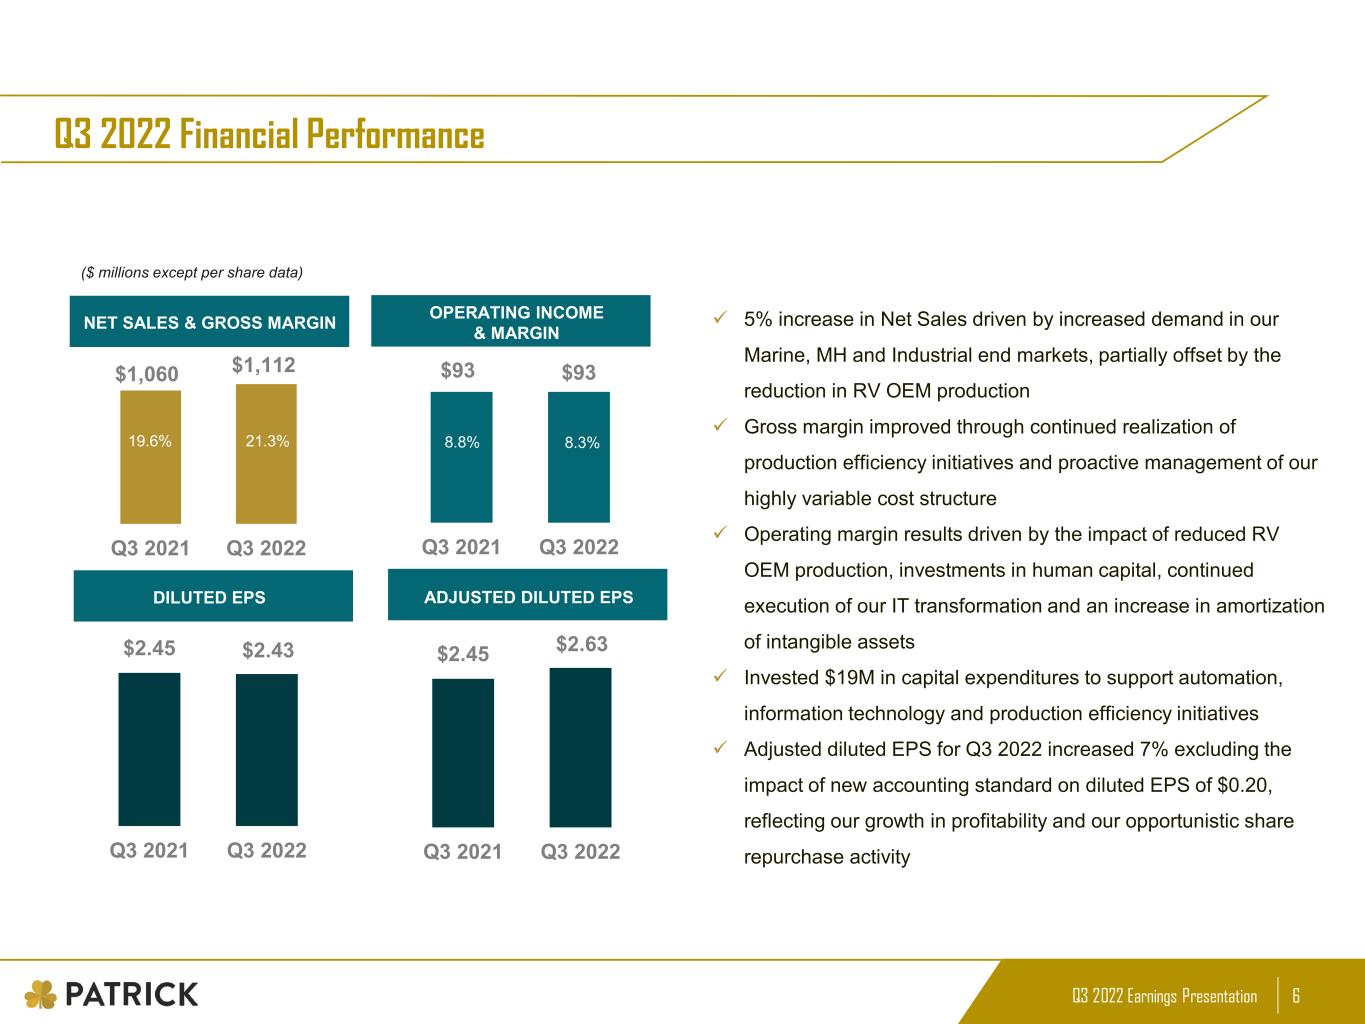
Q3 2022 Earnings Presentation 6 NET SALES & GROSS MARGIN OPERATING INCOME & MARGIN $2.45 $2.63 Q3 2021 Q3 2022 $2.45 $2.43 Q3 2021 Q3 2022 Q3 2022 Financial Performance $93 $93 Q3 2021 Q3 2022 $1,060 $1,112 Q3 2021 Q3 2022 8.8% 8.3% 5% increase in Net Sales driven by increased demand in our Marine, MH and Industrial end markets, partially offset by the reduction in RV OEM production Gross margin improved through continued realization of production efficiency initiatives and proactive management of our highly variable cost structure Operating margin results driven by the impact of reduced RV OEM production, investments in human capital, continued execution of our IT transformation and an increase in amortization of intangible assets Invested $19M in capital expenditures to support automation, information technology and production efficiency initiatives Adjusted diluted EPS for Q3 2022 increased 7% excluding the impact of new accounting standard on diluted EPS of $0.20, reflecting our growth in profitability and our opportunistic share repurchase activity ($ millions except per share data) DILUTED EPS ADJUSTED DILUTED EPS 19.6% 21.3%
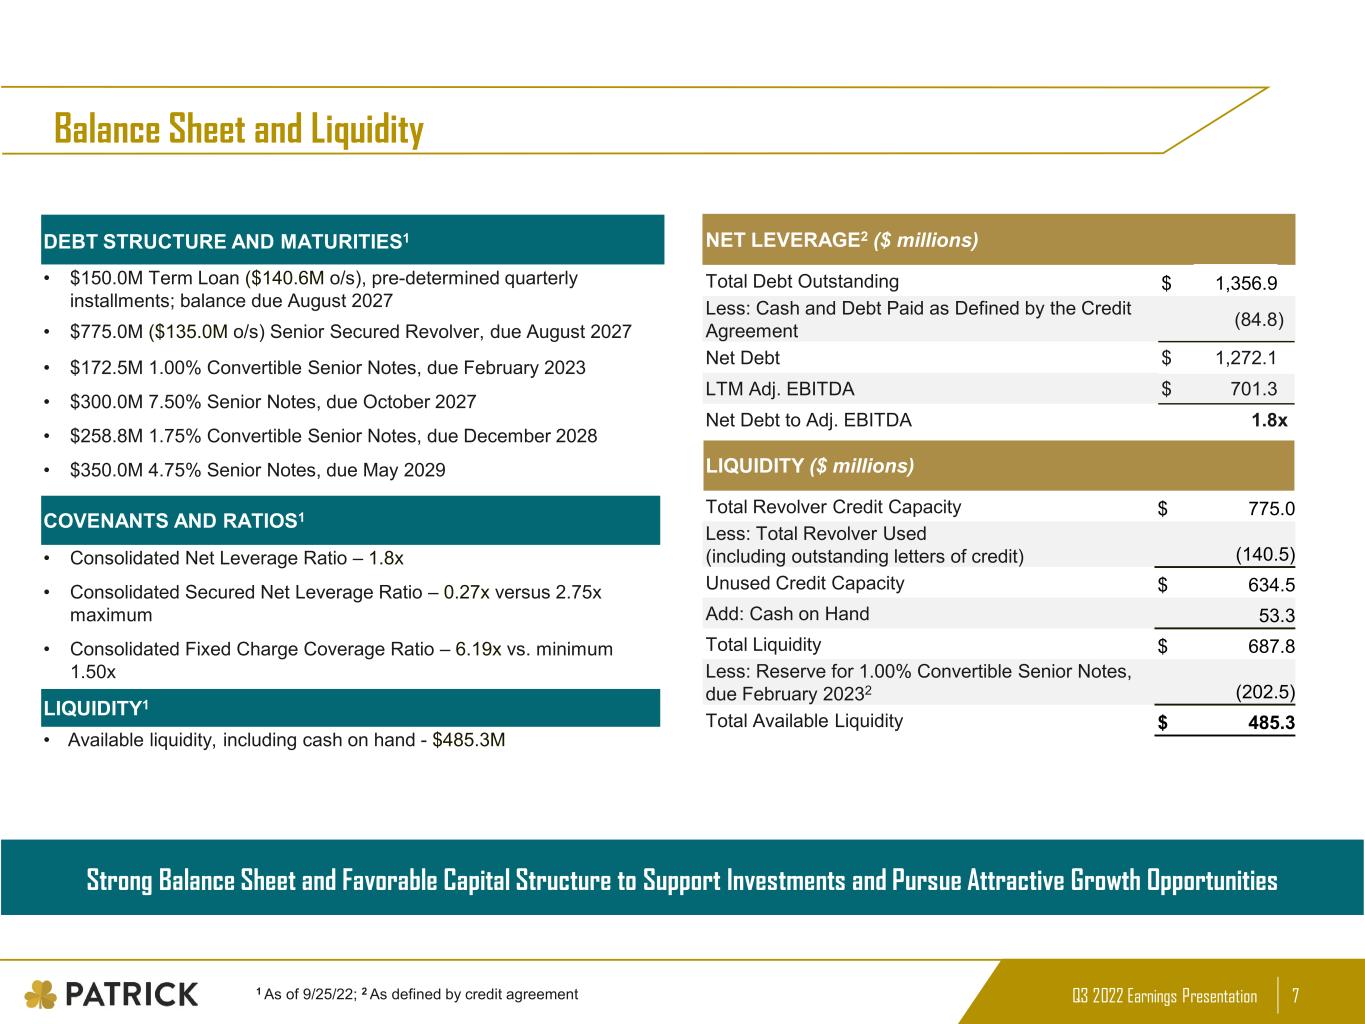
Q3 2022 Earnings Presentation 7 Balance Sheet and Liquidity 1 As of 9/25/22; 2 As defined by credit agreement Strong Balance Sheet and Favorable Capital Structure to Support Investments and Pursue Attractive Growth Opportunities DEBT STRUCTURE AND MATURITIES1 • $150.0M Term Loan ($140.6M o/s), pre-determined quarterly installments; balance due August 2027 • $775.0M ($135.0M o/s) Senior Secured Revolver, due August 2027 • $172.5M 1.00% Convertible Senior Notes, due February 2023 • $300.0M 7.50% Senior Notes, due October 2027 • $258.8M 1.75% Convertible Senior Notes, due December 2028 • $350.0M 4.75% Senior Notes, due May 2029 LIQUIDITY1 • Available liquidity, including cash on hand - $485.3M NET LEVERAGE2 ($ millions) Total Debt Outstanding $ 1,356.9 Less: Cash and Debt Paid as Defined by the Credit Agreement (84.8) Net Debt $ 1,272.1 LTM Adj. EBITDA $ 701.3 Net Debt to Adj. EBITDA 1.8x LIQUIDITY ($ millions) Total Revolver Credit Capacity $ 775.0 Less: Total Revolver Used (including outstanding letters of credit) (140.5) Unused Credit Capacity $ 634.5 Add: Cash on Hand 53.3 Total Liquidity $ 687.8 Less: Reserve for 1.00% Convertible Senior Notes, due February 20232 (202.5) Total Available Liquidity $ 485.3 COVENANTS AND RATIOS1 • Consolidated Net Leverage Ratio – 1.8x • Consolidated Secured Net Leverage Ratio – 0.27x versus 2.75x maximum • Consolidated Fixed Charge Coverage Ratio – 6.19x vs. minimum 1.50x

Q3 2022 Earnings Presentation 8 Appendix
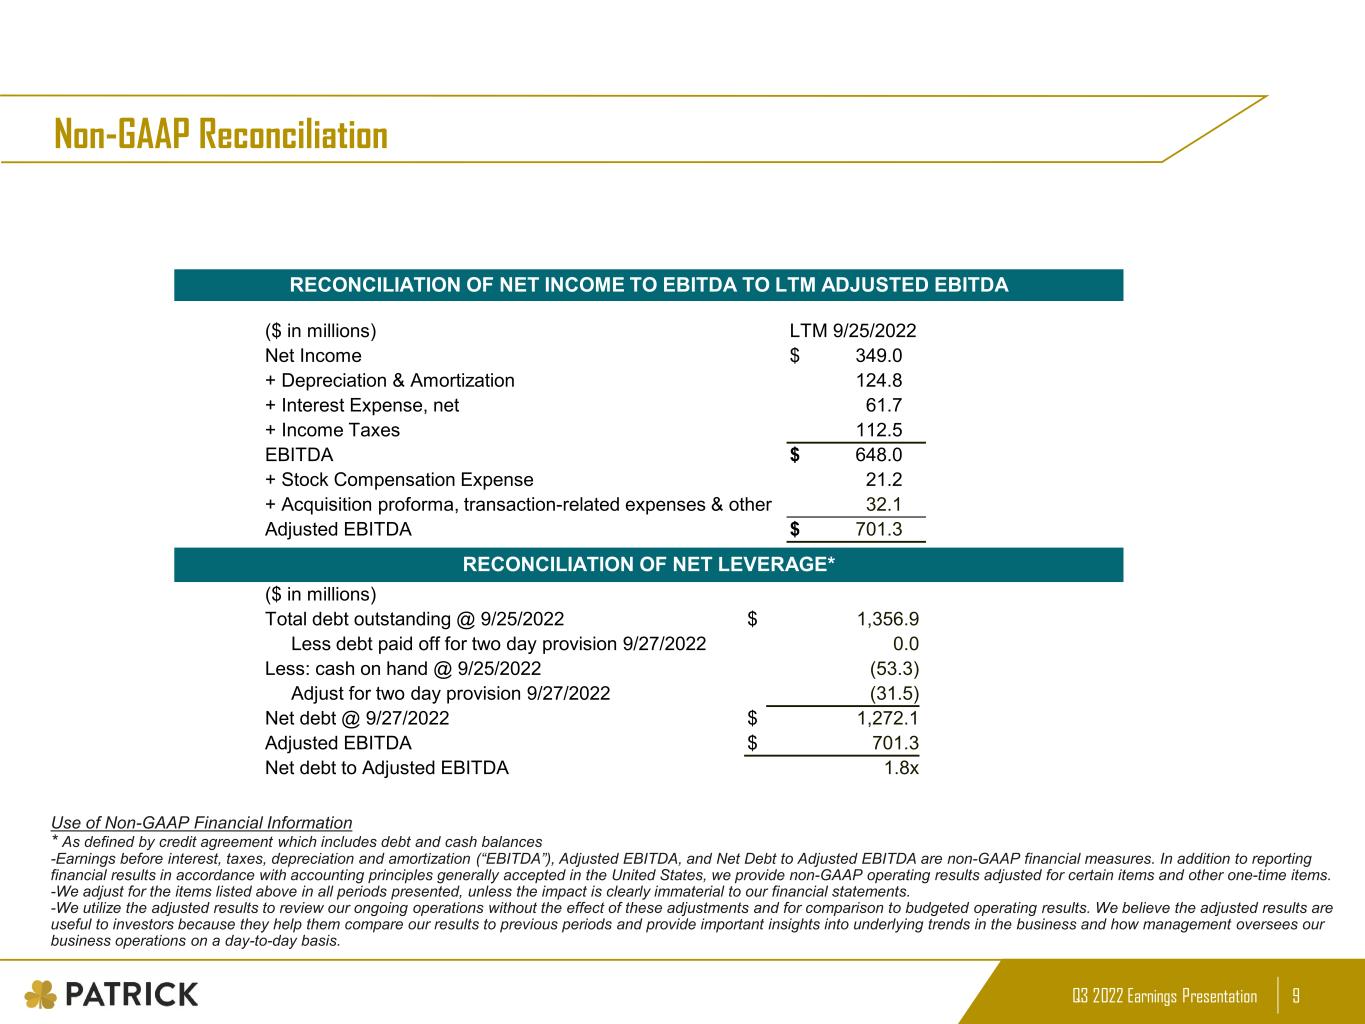
Q3 2022 Earnings Presentation 9 Non-GAAP Reconciliation RECONCILIATION OF NET INCOME TO EBITDA TO LTM ADJUSTED EBITDA ($ in millions) LTM 9/25/2022 Net Income $ 349.0 + Depreciation & Amortization 124.8 + Interest Expense, net 61.7 + Income Taxes 112.5 EBITDA $ 648.0 + Stock Compensation Expense 21.2 + Acquisition proforma, transaction-related expenses & other 32.1 Adjusted EBITDA $ 701.3 RECONCILIATION OF NET LEVERAGE* ($ in millions) Total debt outstanding @ 9/25/2022 $ 1,356.9 Less debt paid off for two day provision 9/27/2022 0.0 Less: cash on hand @ 9/25/2022 (53.3) Adjust for two day provision 9/27/2022 (31.5) Net debt @ 9/27/2022 $ 1,272.1 Adjusted EBITDA $ 701.3 Net debt to Adjusted EBITDA 1.8x Use of Non-GAAP Financial Information * As defined by credit agreement which includes debt and cash balances -Earnings before interest, taxes, depreciation and amortization (“EBITDA”), Adjusted EBITDA, and Net Debt to Adjusted EBITDA are non-GAAP financial measures. In addition to reporting financial results in accordance with accounting principles generally accepted in the United States, we provide non-GAAP operating results adjusted for certain items and other one-time items. -We adjust for the items listed above in all periods presented, unless the impact is clearly immaterial to our financial statements. -We utilize the adjusted results to review our ongoing operations without the effect of these adjustments and for comparison to budgeted operating results. We believe the adjusted results are useful to investors because they help them compare our results to previous periods and provide important insights into underlying trends in the business and how management oversees our business operations on a day-to-day basis.

Q3 2022 Earnings Presentation 10 www.patrickind.com