EX-99.1
Published on August 31, 2023

INVESTOR PRESENTATION August 2023
This presentation contains certain statements related to future results, our intentions, beliefs and expectations or predictions for the future which are forward-looking statements as that term is defined in the Private Securities Litigation Reform Act of 1995. These forward-looking statements involve a number of risks and uncertainties that could cause actual results to differ materially from either historical or anticipated results depending on a variety of factors. These risks and uncertainties include, but are not limited to, the impact of the continuing financial and operational uncertainty due to public health emergencies or pandemics, such as the COVID-19 pandemic, including its impact on the overall economy, our sales, customers, operations, team members and suppliers. Further information concerning the Company and its business, including factors that potentially could materially affect the Company’s financial results, is contained in the Company’s filings with the Securities and Exchange Commission. This presentation includes market and industry data, forecasts and valuations that have been obtained from independent consultant reports, publicly available information, various industry publications and other published industry sources. Although we believe these sources are reliable, we have not independently verified the information and cannot make any representation as to the accuracy or completeness of such information. We disclaim any obligation or undertaking to disseminate any updates or revisions to any forward-looking statements contained in this presentation or to reflect any change in our expectations after the date of this presentation or any change in events, conditions or circumstances on which any statement is based. USE OF NON-GAAP FINANCIAL MEASURES This presentation contains non-GAAP financial measures. These measures, the purposes for which management uses them, why management believes they are useful to investors, and a reconciliation to the most directly comparable GAAP financial measures can be found in the Appendix of this presentation. All references to profit measures and earnings per share on a comparable basis exclude items that affect comparability. 2
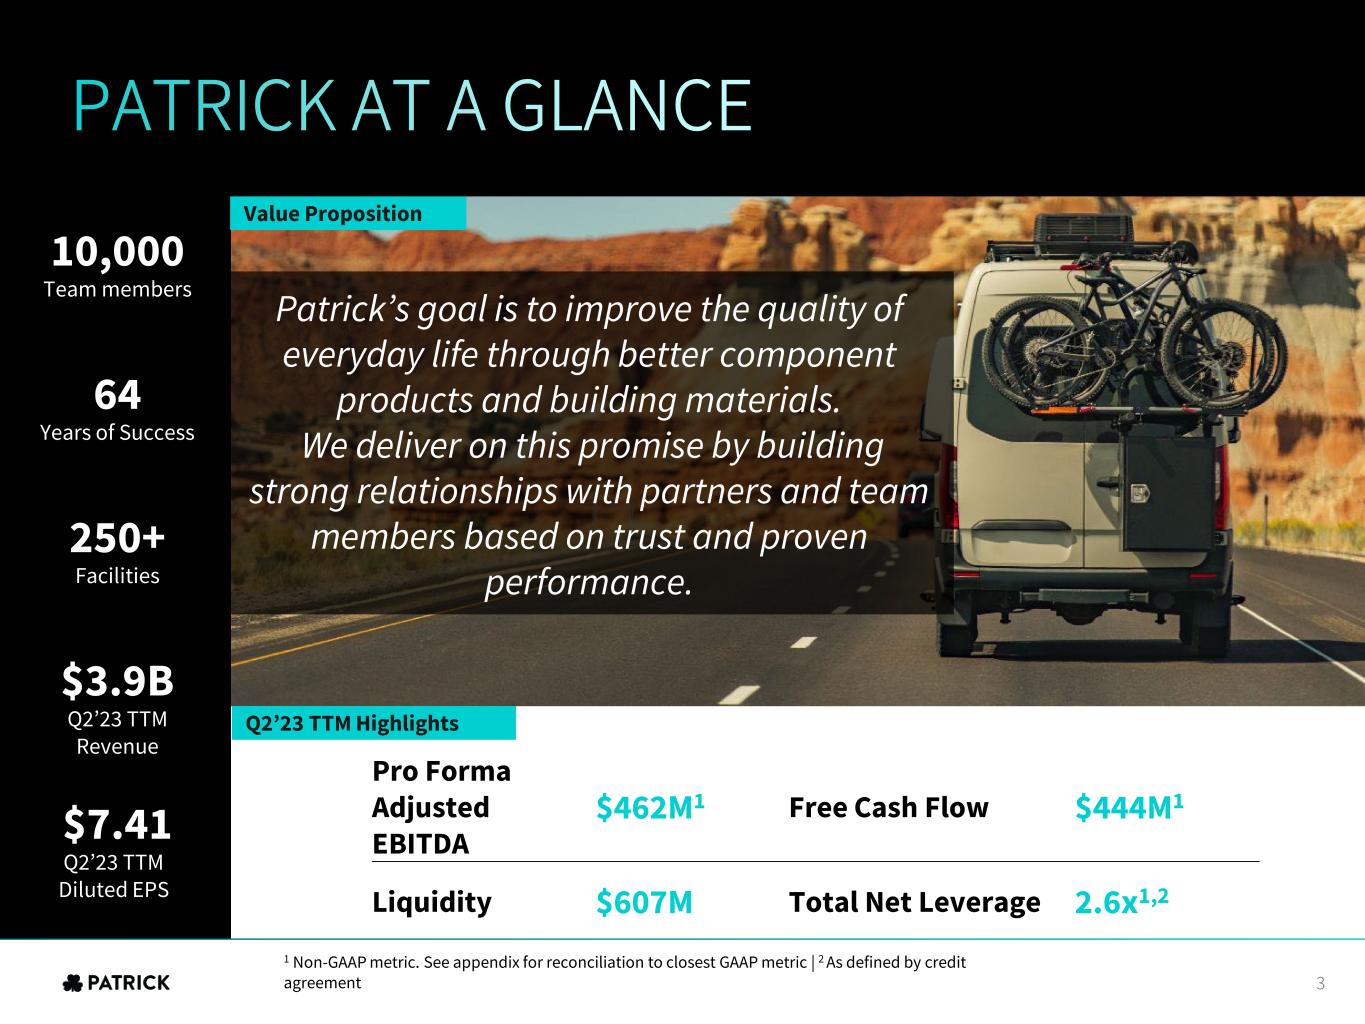
3 Team members 10,000 Years of Success 64 Facilities 250+ Q2’23 TTM Revenue $3.9B Q2’23 TTM Diluted EPS $7.41 Pro Forma Adjusted EBITDA $462M1 Free Cash Flow $444M1 Liquidity $607M Total Net Leverage 2.6x1,2 1 Non-GAAP metric. See appendix for reconciliation to closest GAAP metric | 2 As defined by credit agreement Q2’23 TTM Highlights Value Proposition 3 Patrick’s goal is to improve the quality of everyday life through better component products and building materials. We deliver on this promise by building strong relationships with partners and team members based on trust and proven performance.
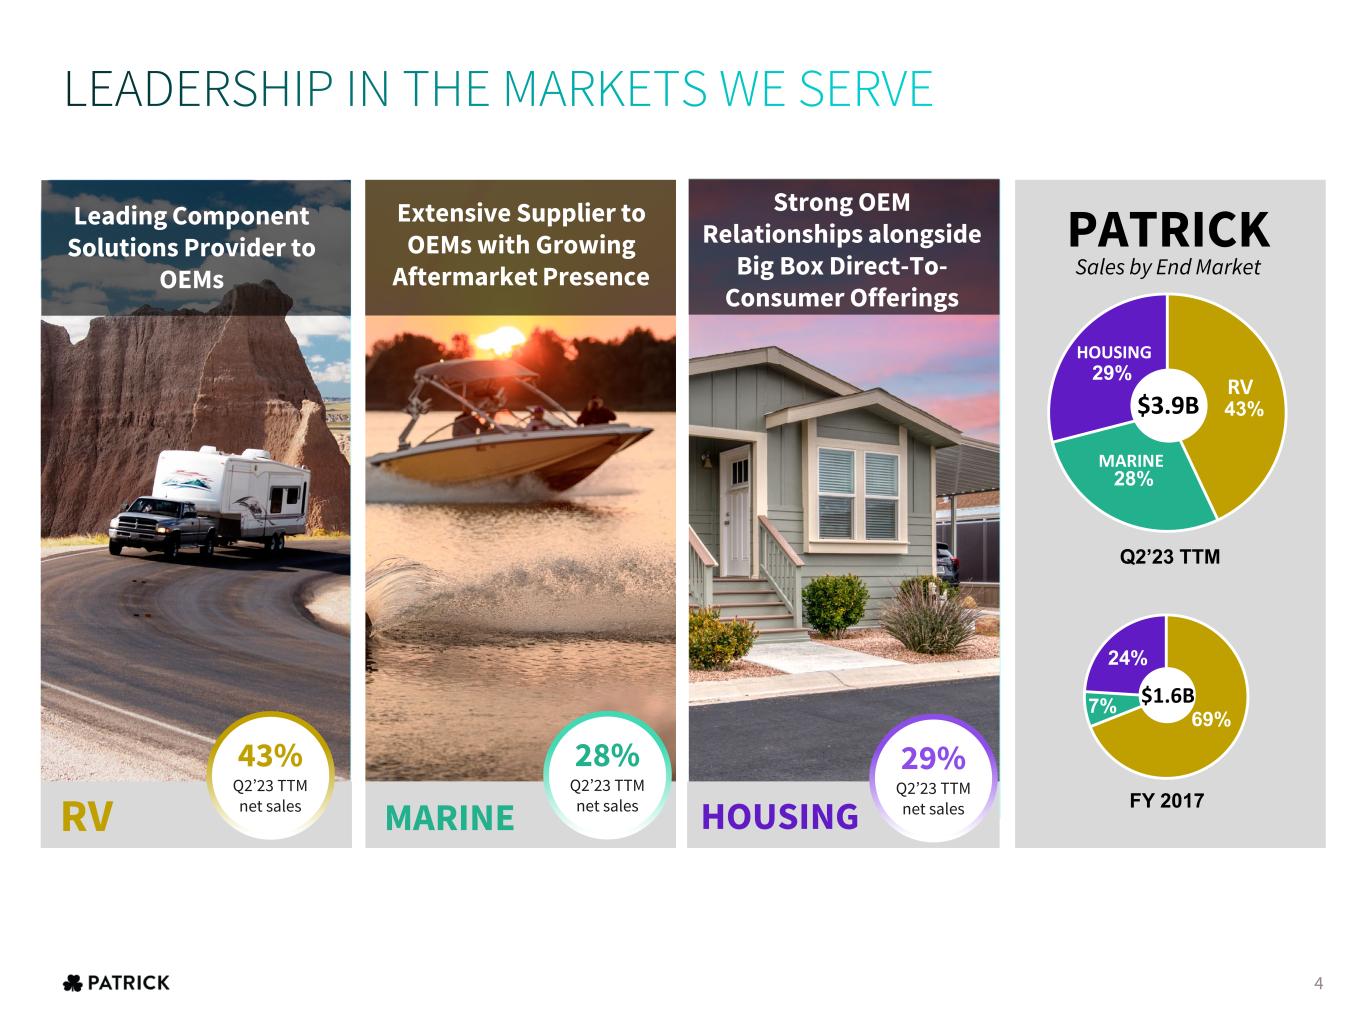
RV MARINE HOUSING PATRICK Sales by End Market 43% 28% 29% Q2’23 TTM RV HOUSING MARINE 69%7% 24% FY 2017 Extensive Supplier to OEMs with Growing Aftermarket Presence Strong OEM Relationships alongside Big Box Direct-To- Consumer Offerings 4 $3.9B $1.6B Leading Component Solutions Provider to OEMs 43% Q2’23 TTM net sales 28% Q2’23 TTM net sales 29% Q2’23 TTM net sales
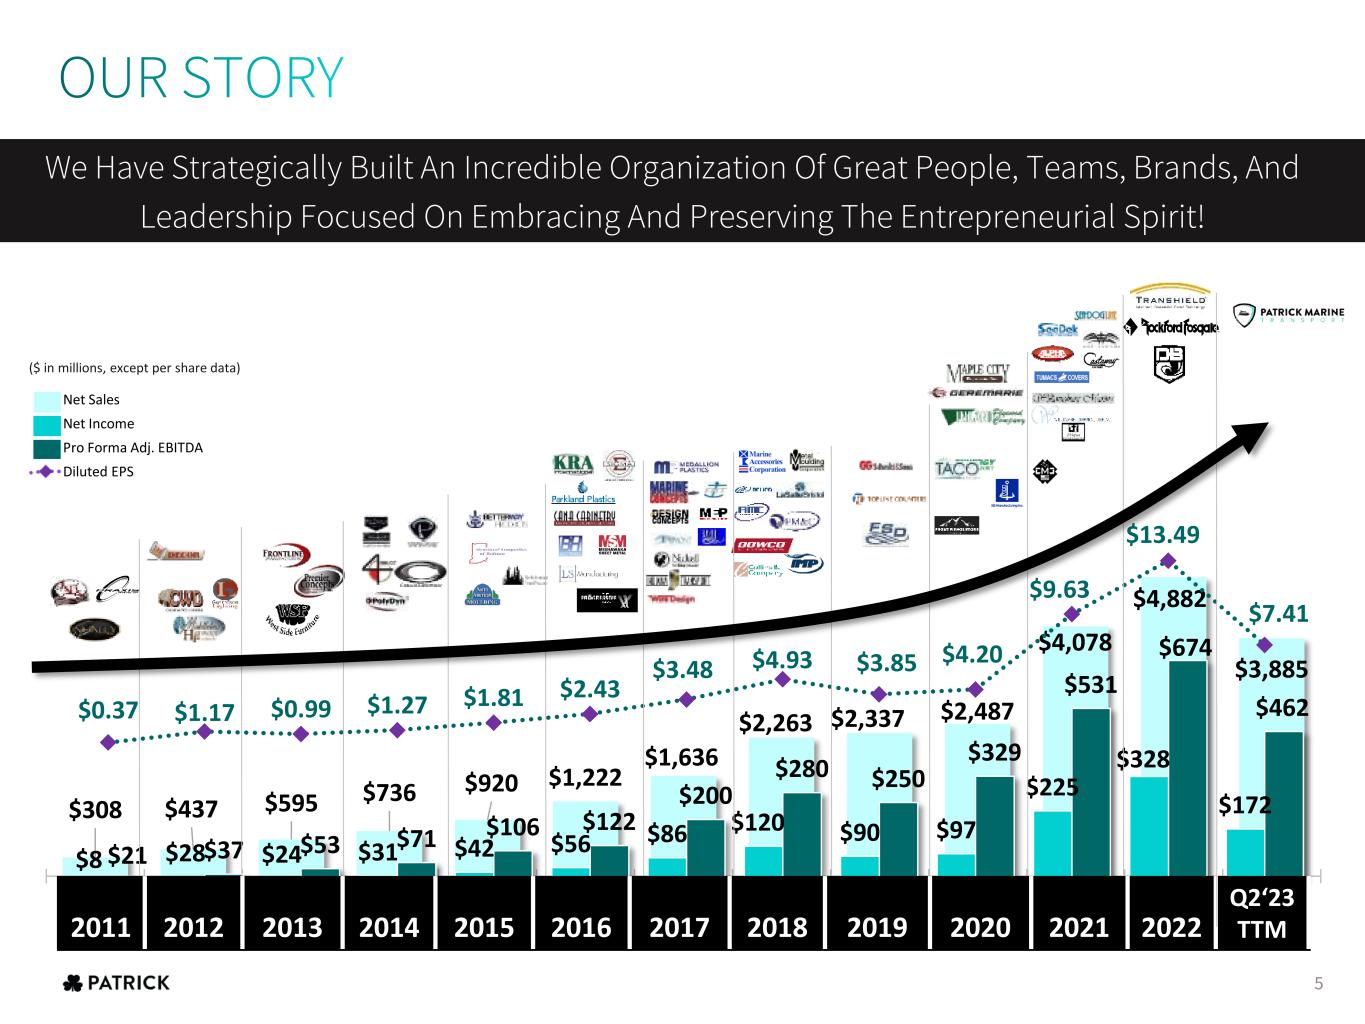
$308 $437 $595 $736 $920 $1,222 $1,636 $2,263 $2,337 $2,487 $4,078 $4,882 $3,885 2011 2012 2013 2014 2015 2016 2017 2018 2019 2020 2021 2022 Q1 23 TTm $8 $28 $24 $31 $42 $56 $86 $120 $90 $97 $225 $328 $172 $21 $37 $53 $71 $106 $122 $200 $280 $250 $329 $531 $674 $462 $0.37 $1.17 $0.99 $1.27 $1.81 $2.43 $3.48 $4.93 $3.85 $4.20 $9.63 $13.49 $7.41 2011 2012 2013 2014 2015 2016 2017 2018 2019 2020 2021 2022 Q1 2023 TTM Net Sales Net Income Pro Forma Adj. EBITDA Diluted EPS We Have Strategically Built An Incredible Organization Of Great People, Teams, Brands, And Leadership Focused On Embracing And Preserving The Entrepreneurial Spirit! ($ in millions, except per share data) 2011 2012 2013 2014 2015 2016 2017 2018 2019 2020 2021 2022 Q2‘23 TTM 5
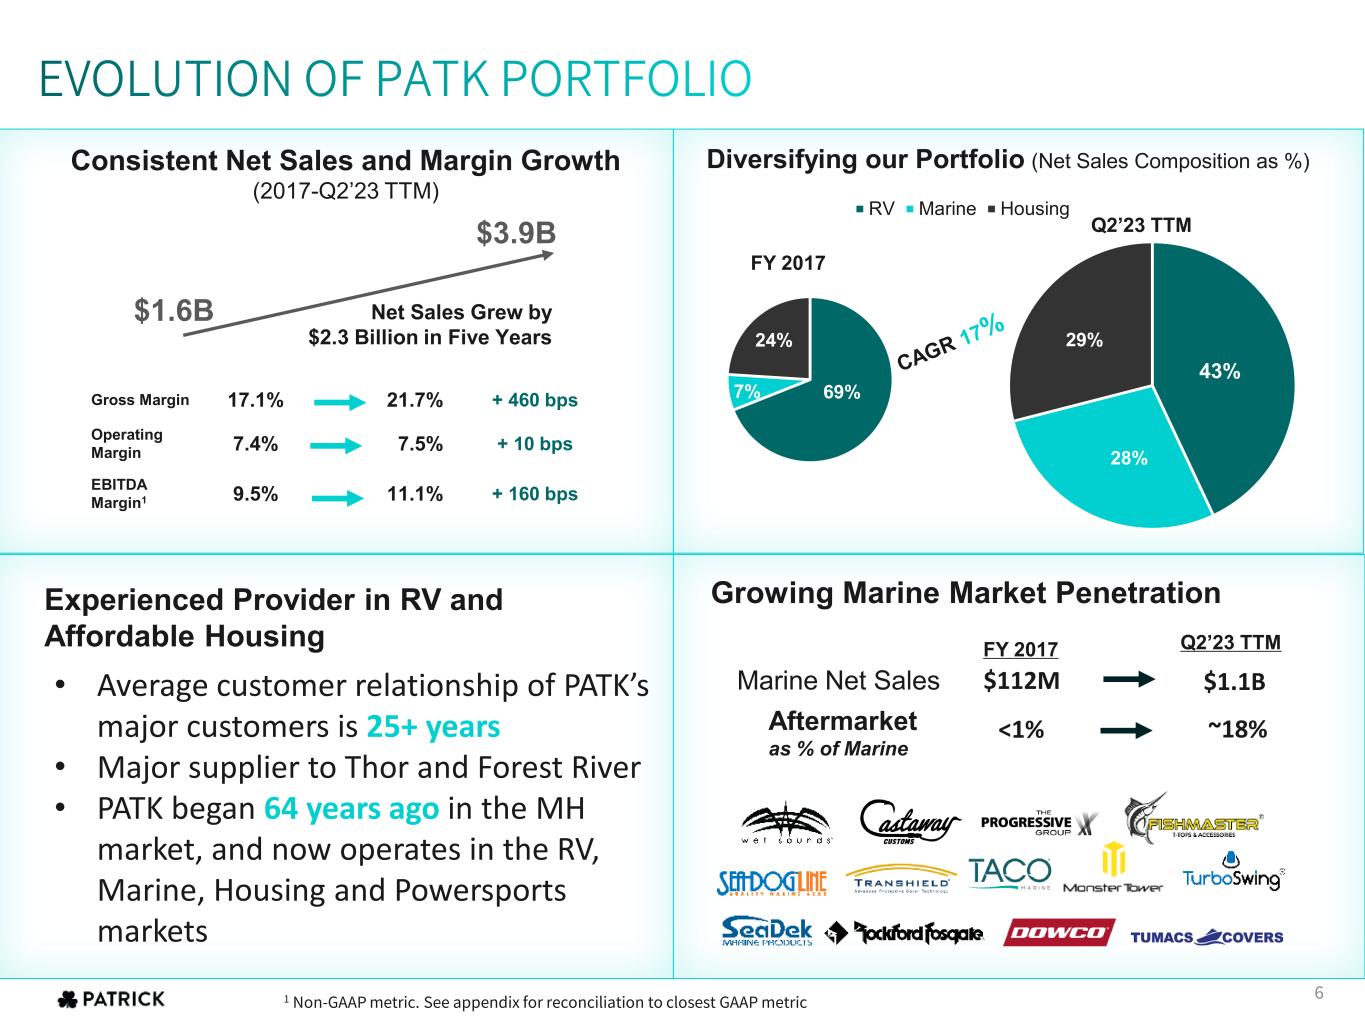
43% 28% 29% RV Marine Housing $3.9B Net Sales Grew by $2.3 Billion in Five Years $1.6B Diversifying our Portfolio (Net Sales Composition as %) Q2’23 TTM Growing Marine Market Penetration Consistent Net Sales and Margin Growth (2017-Q2’23 TTM) Experienced Provider in RV and Affordable Housing Gross Margin 17.1% 21.7% + 460 bps Operating Margin 7.4% 7.5% + 10 bps EBITDA Margin1 9.5% 11.1% + 160 bps FY 2017 69%7% 24% <1% ~18% Marine Net Sales Aftermarket as % of Marine $112M $1.1B• Average customer relationship of PATK’s major customers is 25+ years • Major supplier to Thor and Forest River • PATK began 64 years ago in the MH market, and now operates in the RV, Marine, Housing and Powersports markets FY 2017 Q2’23 TTM 61 Non-GAAP metric. See appendix for reconciliation to closest GAAP metric
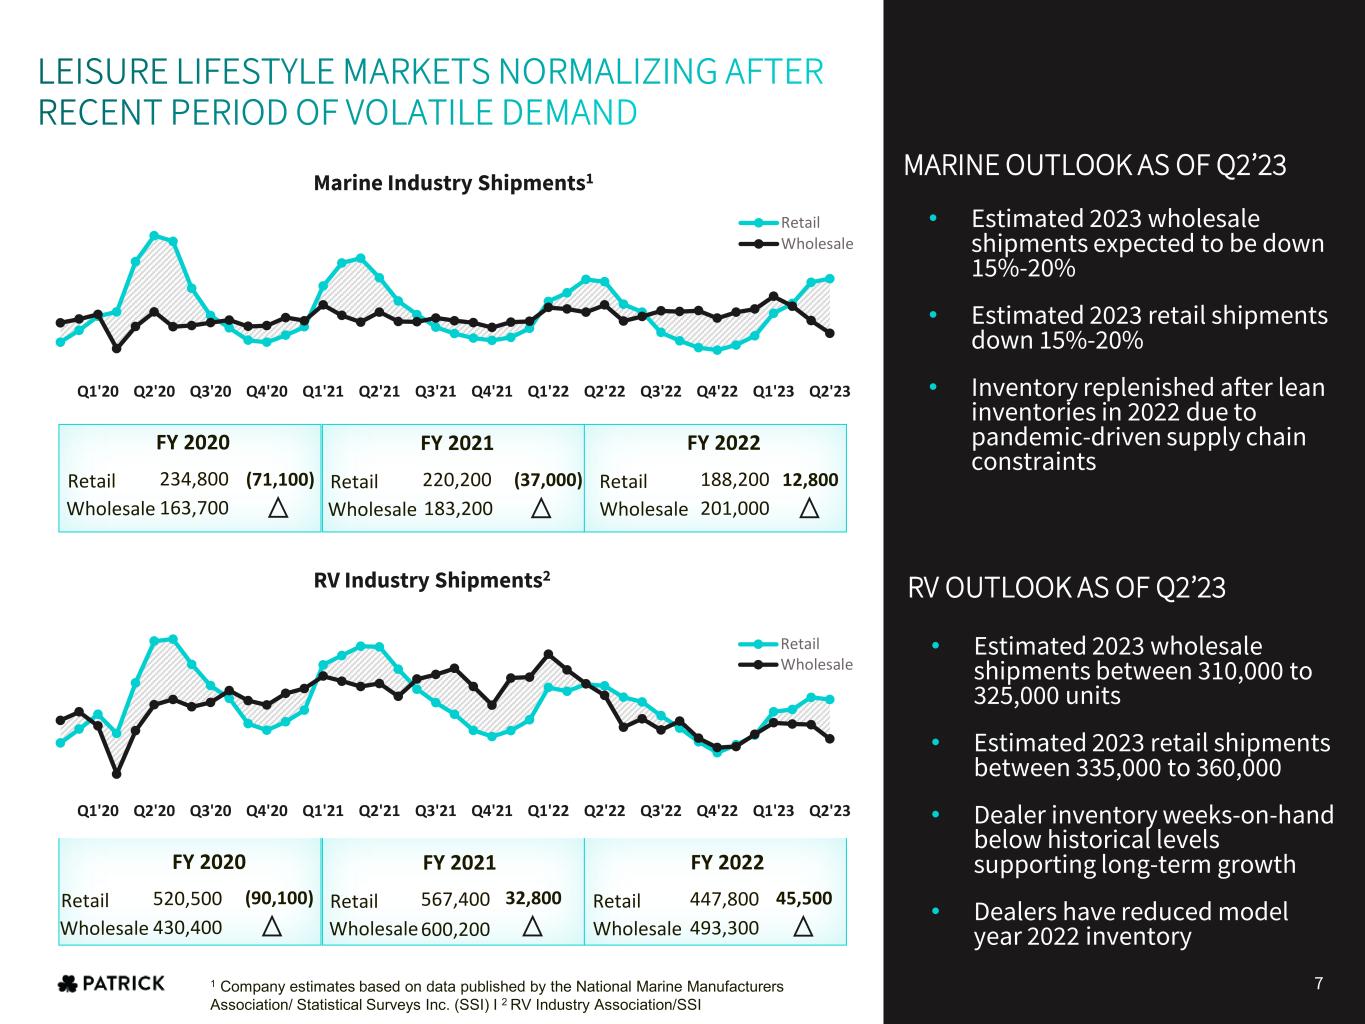
FY 2021 FY 2022FY 2020 WholesaleWholesaleWholesale Q1'20 Q2'20 Q3'20 Q4'20 Q1'21 Q2'21 Q3'21 Q4'21 Q1'22 Q2'22 Q3'22 Q4'22 Q1'23 Q2'23 Retail Wholesale 493,300 Retail Wholesale 234,800 163,700 1 Company estimates based on data published by the National Marine Manufacturers Association/ Statistical Surveys Inc. (SSI) I 2 RV Industry Association/SSI (71,100) Retail Wholesale 220,200 183,200 Retail Wholesale 188,200 201,000 Q1'20 Q2'20 Q3'20 Q4'20 Q1'21 Q2'21 Q3'21 Q4'21 Q1'22 Q2'22 Q3'22 Q4'22 Q1'23 Q2'23 Retail Wholesale Retail 520,500 FY 2020 430,400 FY 2021 Retail 567,400 600,200 FY 2022 Retail 447,800 (37,000) 12,800 (90,100) 32,800 45,500 Marine Industry Shipments1 RV Industry Shipments2 • Estimated 2023 wholesale shipments expected to be down 15%-20% • Estimated 2023 retail shipments down 15%-20% • Inventory replenished after lean inventories in 2022 due to pandemic-driven supply chain constraints • Estimated 2023 wholesale shipments between 310,000 to 325,000 units • Estimated 2023 retail shipments between 335,000 to 360,000 • Dealer inventory weeks-on-hand below historical levels supporting long-term growth • Dealers have reduced model year 2022 inventory MARINE OUTLOOK AS OF Q2’23 RV OUTLOOK AS OF Q2’23 7
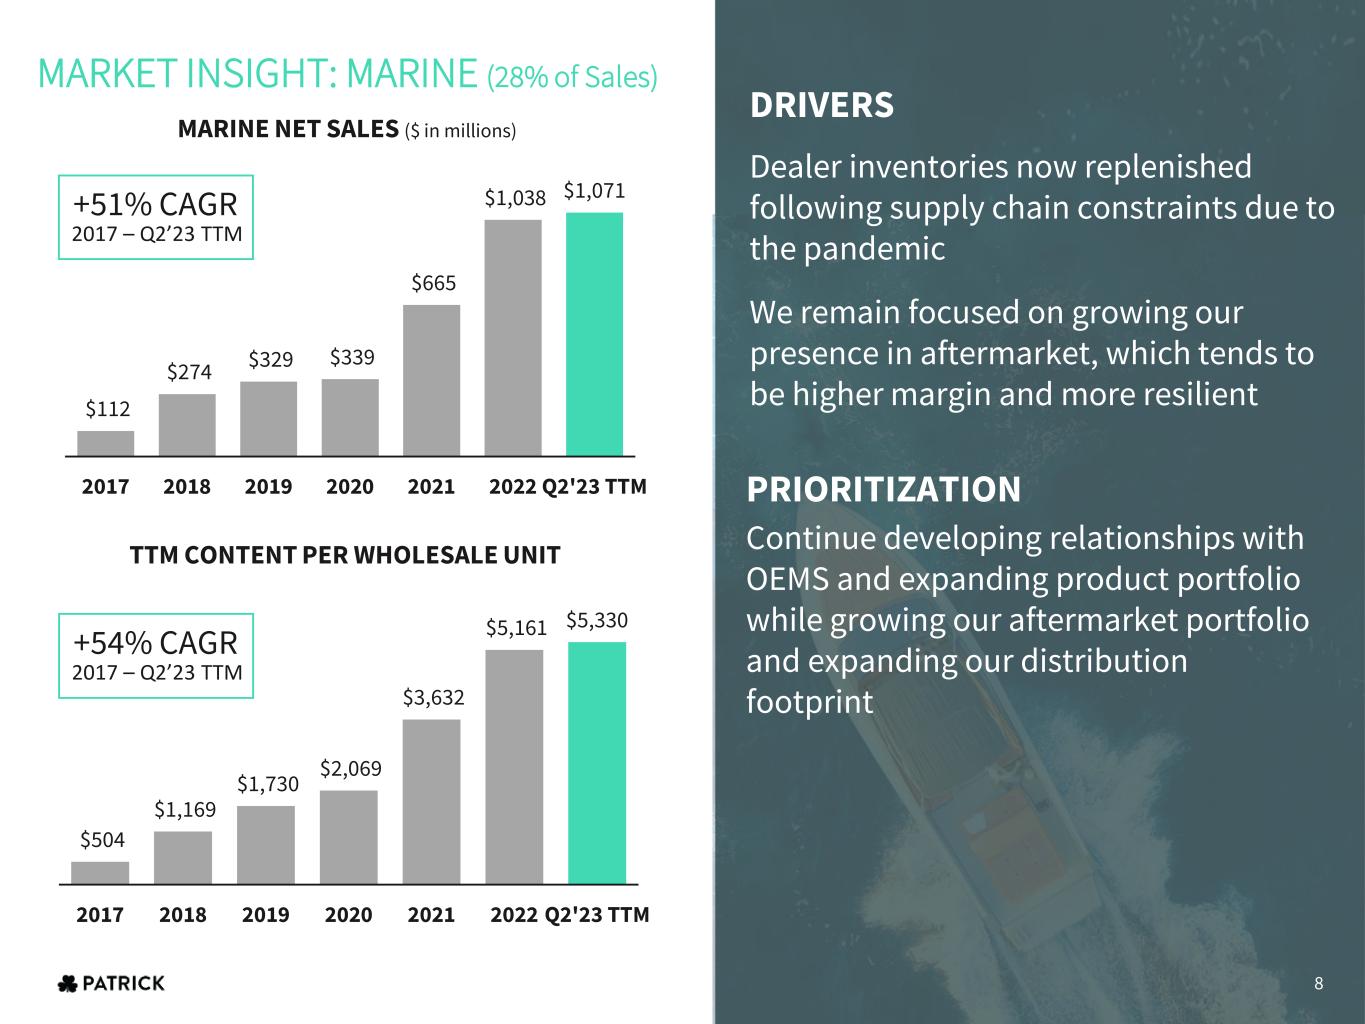
Dealer inventories now replenished following supply chain constraints due to the pandemic We remain focused on growing our presence in aftermarket, which tends to be higher margin and more resilient MARINE NET SALES ($ in millions) TTM CONTENT PER WHOLESALE UNIT $112 $274 $329 $339 $665 $1,038 $1,071 2017 2018 2019 2020 2021 2022 Q2'23 TTM $504 $1,169 $1,730 $2,069 $3,632 $5,161 $5,330 2017 2018 2019 2020 2021 2022 Q2'23 TTM PRIORITIZATION Continue developing relationships with OEMS and expanding product portfolio while growing our aftermarket portfolio and expanding our distribution footprint MARKET INSIGHT: MARINE (28% of Sales) DRIVERS +51% CAGR 2017 – Q2’23 TTM +54% CAGR 2017 – Q2’23 TTM 8
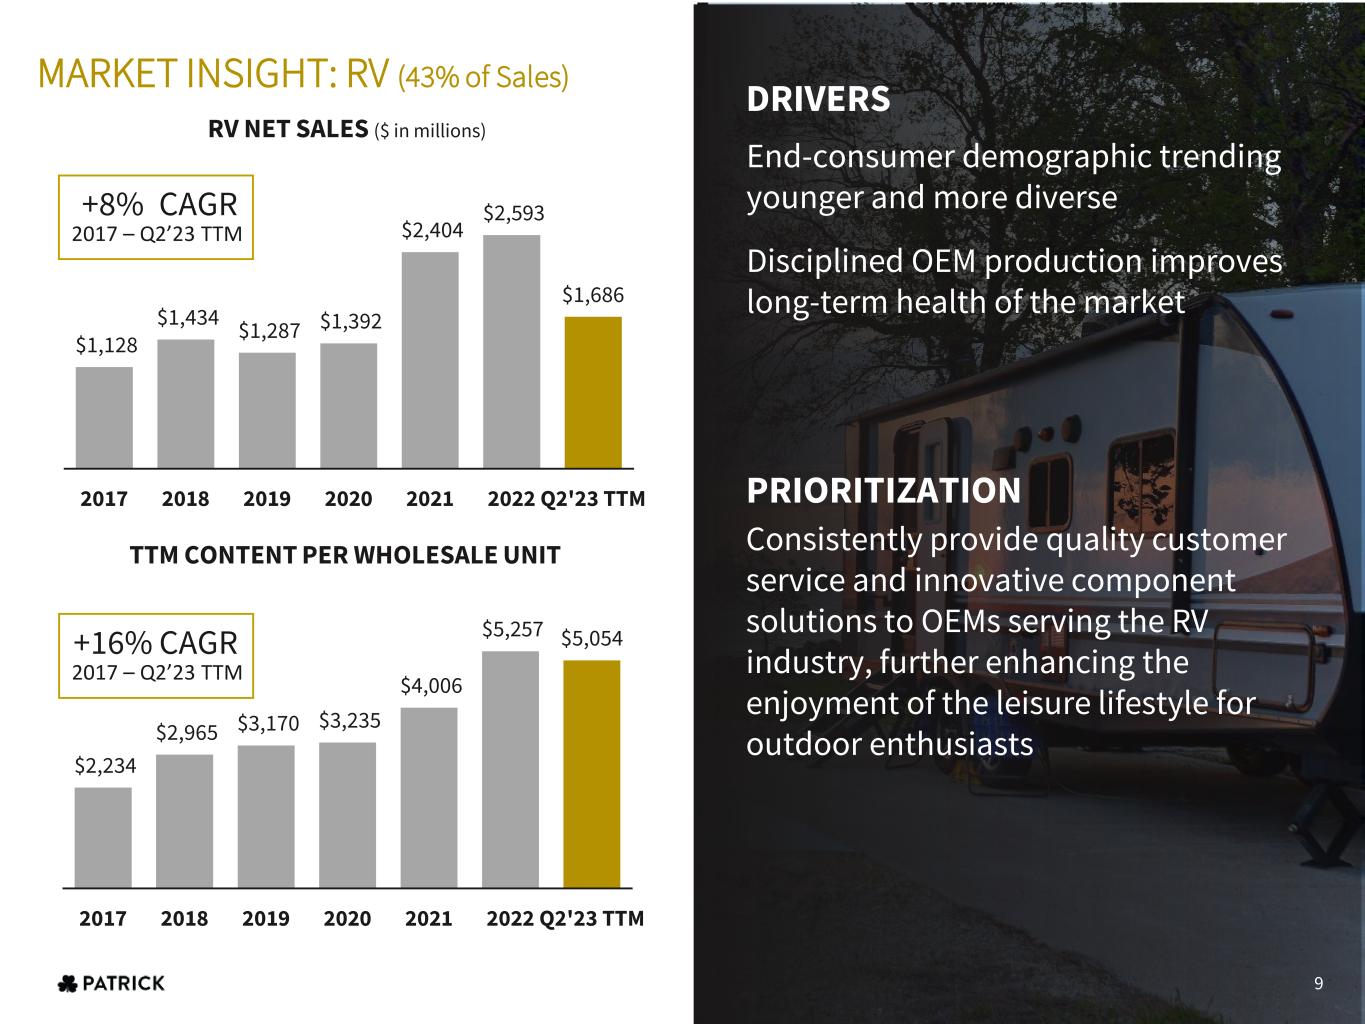
End-consumer demographic trending younger and more diverse Disciplined OEM production improves long-term health of the market $1,128 $1,434 $1,287 $1,392 $2,404 $2,593 $1,686 2017 2018 2019 2020 2021 2022 Q2'23 TTM $2,234 $2,965 $3,170 $3,235 $4,006 $5,257 $5,054 2017 2018 2019 2020 2021 2022 Q2'23 TTM PRIORITIZATION Consistently provide quality customer service and innovative component solutions to OEMs serving the RV industry, further enhancing the enjoyment of the leisure lifestyle for outdoor enthusiasts MARKET INSIGHT: RV (43% of Sales) DRIVERS RV NET SALES ($ in millions) TTM CONTENT PER WHOLESALE UNIT +8% CAGR 2017 – Q2’23 TTM +16% CAGR 2017 – Q2’23 TTM 9
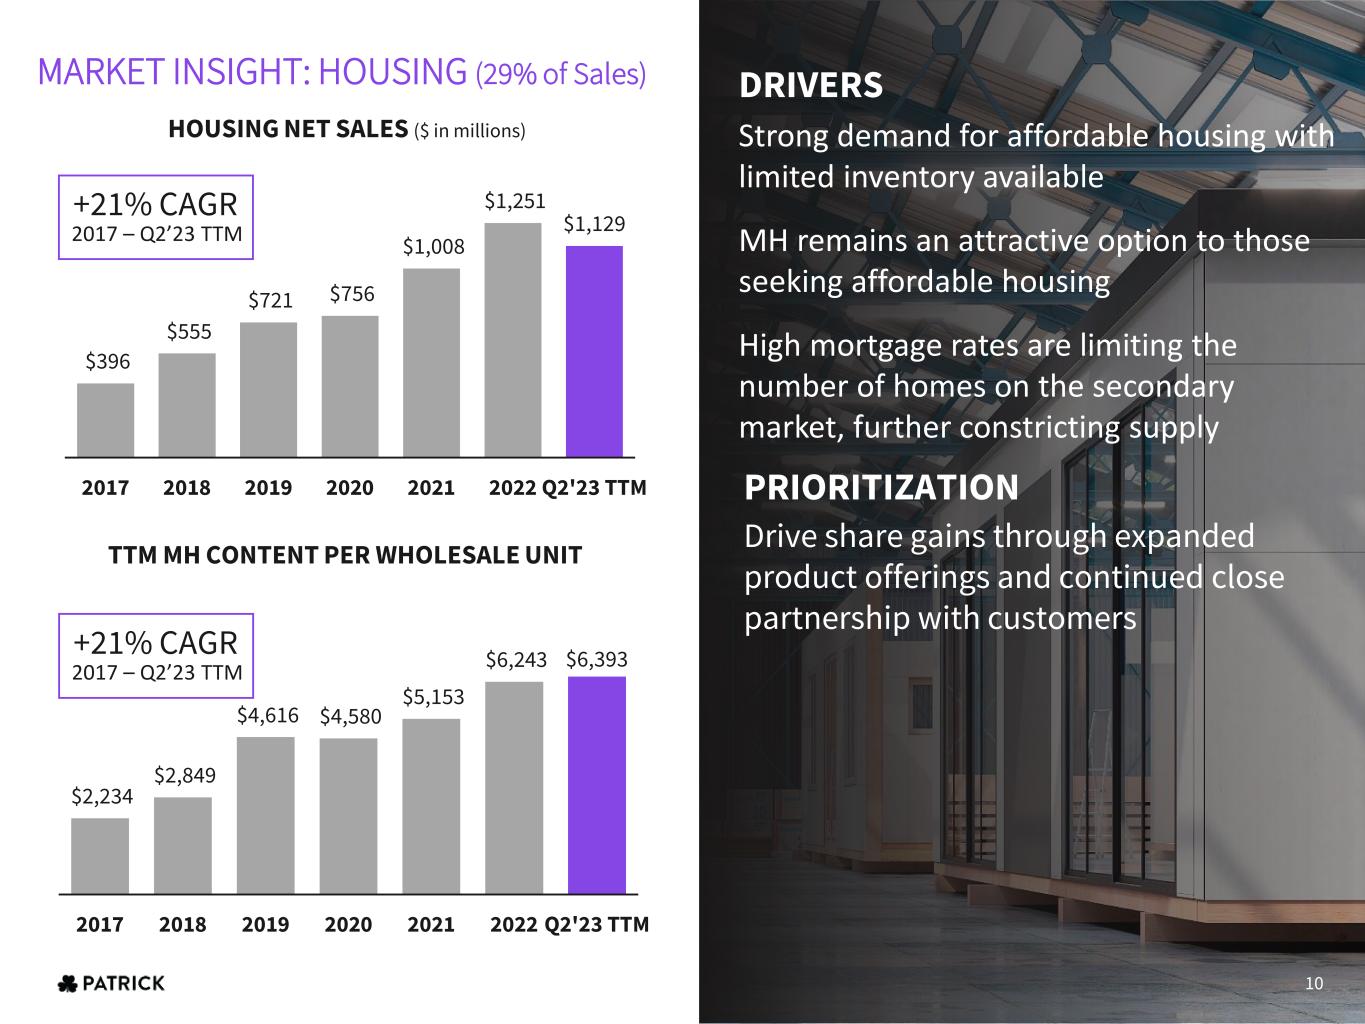
Strong demand for affordable housing with limited inventory available MH remains an attractive option to those seeking affordable housing High mortgage rates are limiting the number of homes on the secondary market, further constricting supply $396 $555 $721 $756 $1,008 $1,251 $1,129 2017 2018 2019 2020 2021 2022 Q2'23 TTM $2,234 $2,849 $4,616 $4,580 $5,153 $6,243 $6,393 2017 2018 2019 2020 2021 2022 Q2'23 TTM PRIORITIZATION Drive share gains through expanded product offerings and continued close partnership with customers MARKET INSIGHT: HOUSING (29% of Sales) DRIVERS HOUSING NET SALES ($ in millions) TTM MH CONTENT PER WHOLESALE UNIT +21% CAGR 2017 – Q2’23 TTM +21% CAGR 2017 – Q2’23 TTM 10
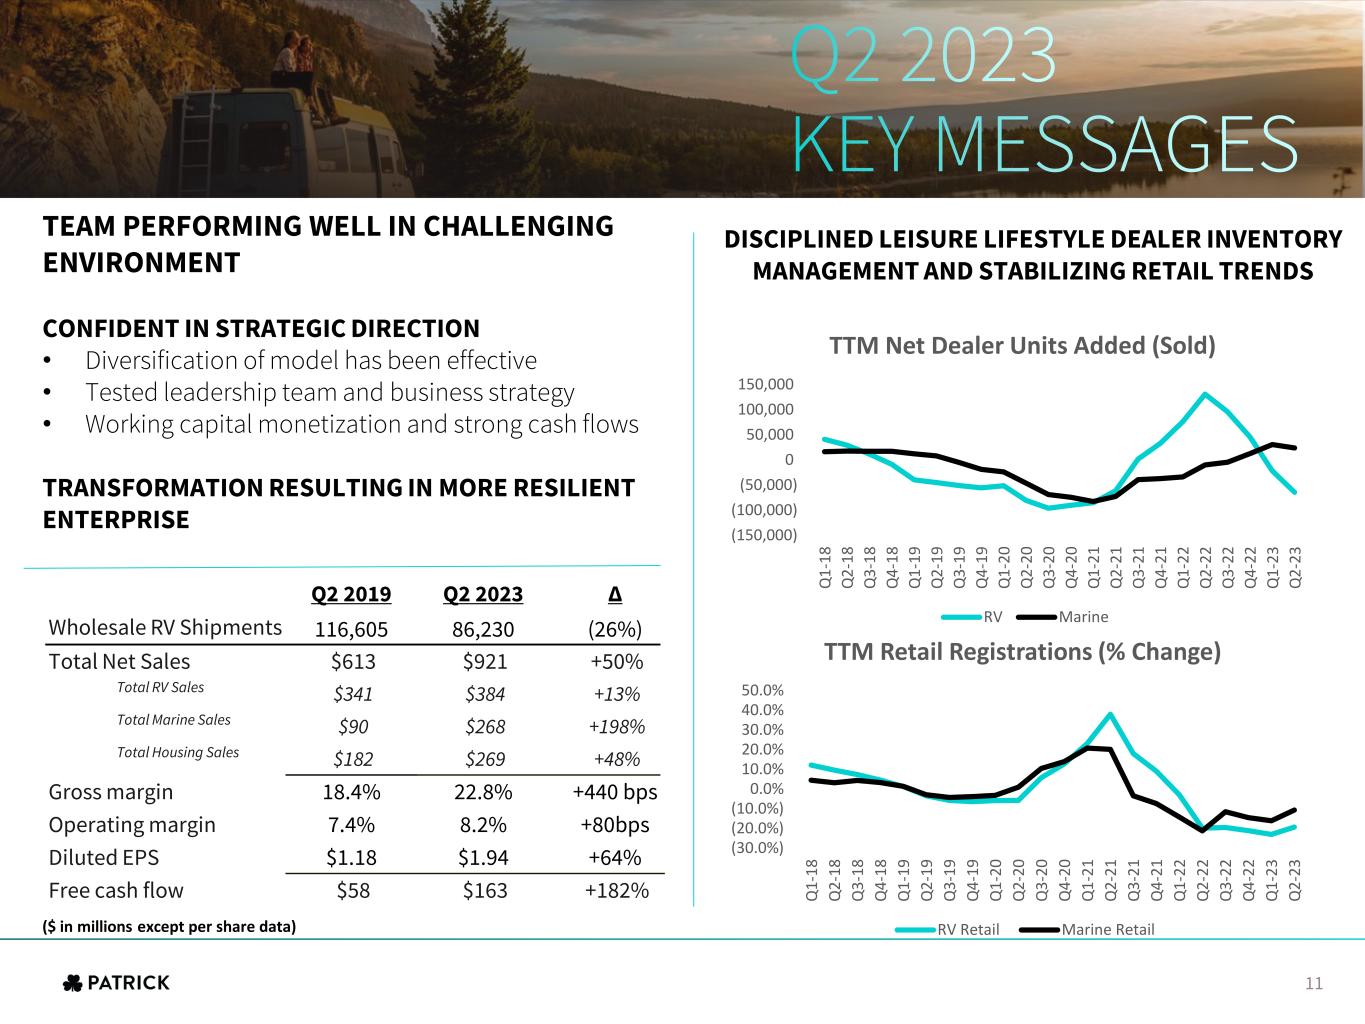
TEAM PERFORMING WELL IN CHALLENGING ENVIRONMENT CONFIDENT IN STRATEGIC DIRECTION • Diversification of model has been effective • Tested leadership team and business strategy • Working capital monetization and strong cash flows TRANSFORMATION RESULTING IN MORE RESILIENT ENTERPRISE Q2 2019 Q2 2023 Δ Wholesale RV Shipments 116,605 86,230 (26%) Total Net Sales $613 $921 +50% Total RV Sales $341 $384 +13% Total Marine Sales $90 $268 +198% Total Housing Sales $182 $269 +48% Gross margin 18.4% 22.8% +440 bps Operating margin 7.4% 8.2% +80bps Diluted EPS $1.18 $1.94 +64% Free cash flow $58 $163 +182% DISCIPLINED LEISURE LIFESTYLE DEALER INVENTORY MANAGEMENT AND STABILIZING RETAIL TRENDS ($ in millions except per share data) (150,000) (100,000) (50,000) 0 50,000 100,000 150,000 Q 1- 18 Q 2- 18 Q 3- 18 Q 4- 18 Q 1- 19 Q 2- 19 Q 3- 19 Q 4- 19 Q 1- 20 Q 2- 20 Q 3- 20 Q 4- 20 Q 1- 21 Q 2- 21 Q 3- 21 Q 4- 21 Q 1- 22 Q 2- 22 Q 3- 22 Q 4- 22 Q 1- 23 Q 2- 23 TTM Net Dealer Units Added (Sold) RV Marine (30.0%) (20.0%) (10.0%) 0.0% 10.0% 20.0% 30.0% 40.0% 50.0% Q 1- 18 Q 2- 18 Q 3- 18 Q 4- 18 Q 1- 19 Q 2- 19 Q 3- 19 Q 4- 19 Q 1- 20 Q 2- 20 Q 3- 20 Q 4- 20 Q 1- 21 Q 2- 21 Q 3- 21 Q 4- 21 Q 1- 22 Q 2- 22 Q 3- 22 Q 4- 22 Q 1- 23 Q 2- 23 TTM Retail Registrations (% Change) RV Retail Marine Retail 11
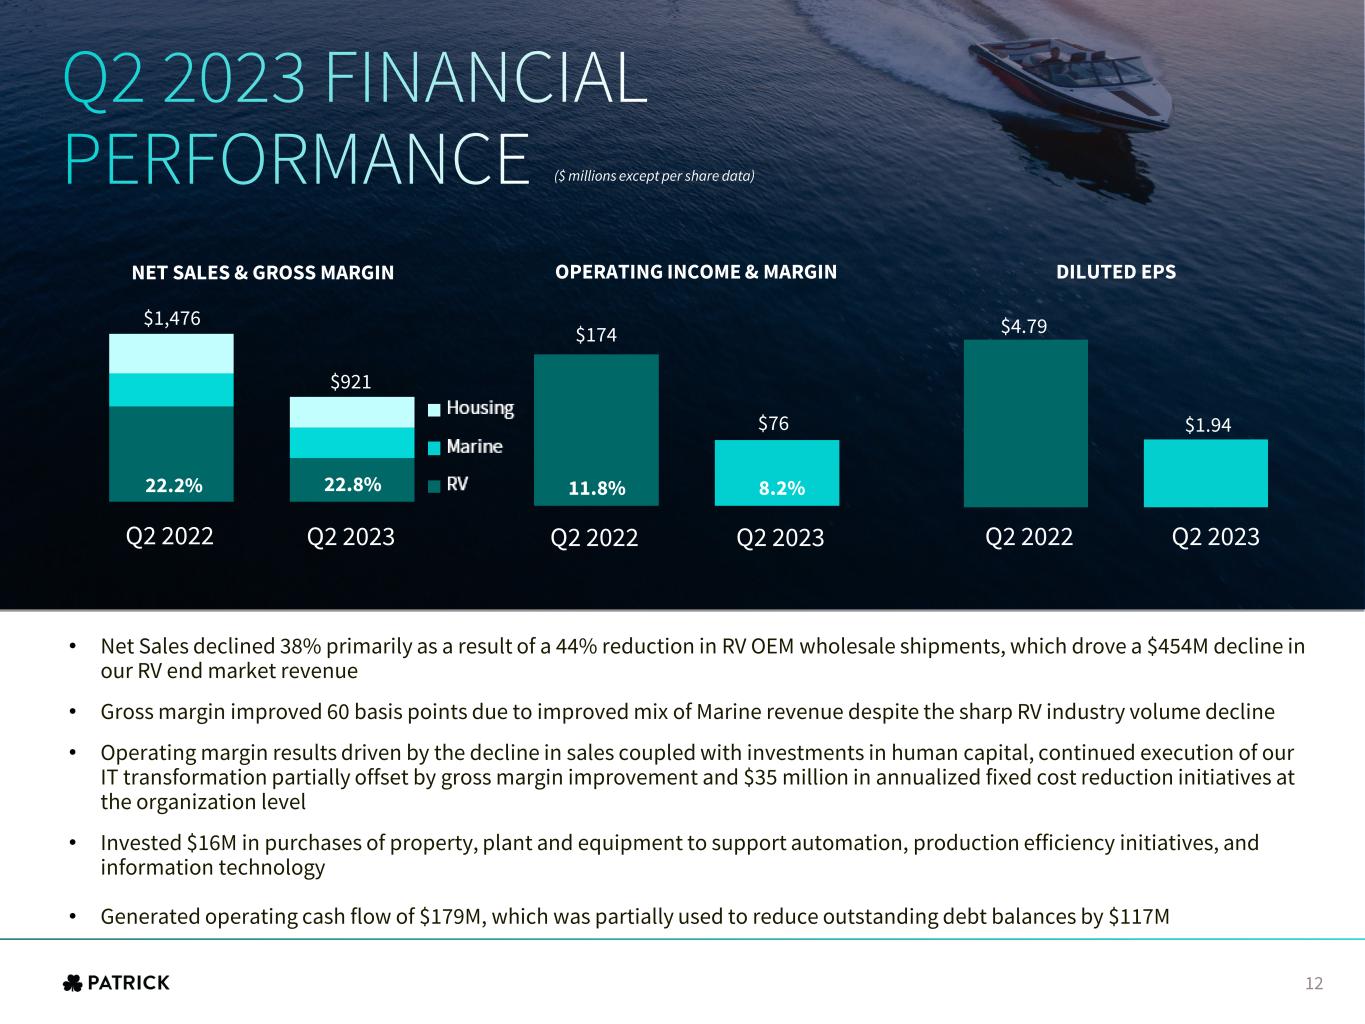
$4.79 $1.94 $174 $76 11.8% 8.2% • Net Sales declined 38% primarily as a result of a 44% reduction in RV OEM wholesale shipments, which drove a $454M decline in our RV end market revenue • Gross margin improved 60 basis points due to improved mix of Marine revenue despite the sharp RV industry volume decline • Operating margin results driven by the decline in sales coupled with investments in human capital, continued execution of our IT transformation partially offset by gross margin improvement and $35 million in annualized fixed cost reduction initiatives at the organization level • Invested $16M in purchases of property, plant and equipment to support automation, production efficiency initiatives, and information technology • Generated operating cash flow of $179M, which was partially used to reduce outstanding debt balances by $117M ($ millions except per share data) DILUTED EPSOPERATING INCOME & MARGINNET SALES & GROSS MARGIN Q2 2022 Q2 2022 Q2 2023 Q2 2022 Q2 2023Q2 2023 22.2% 22.8% $921 $1,476 12
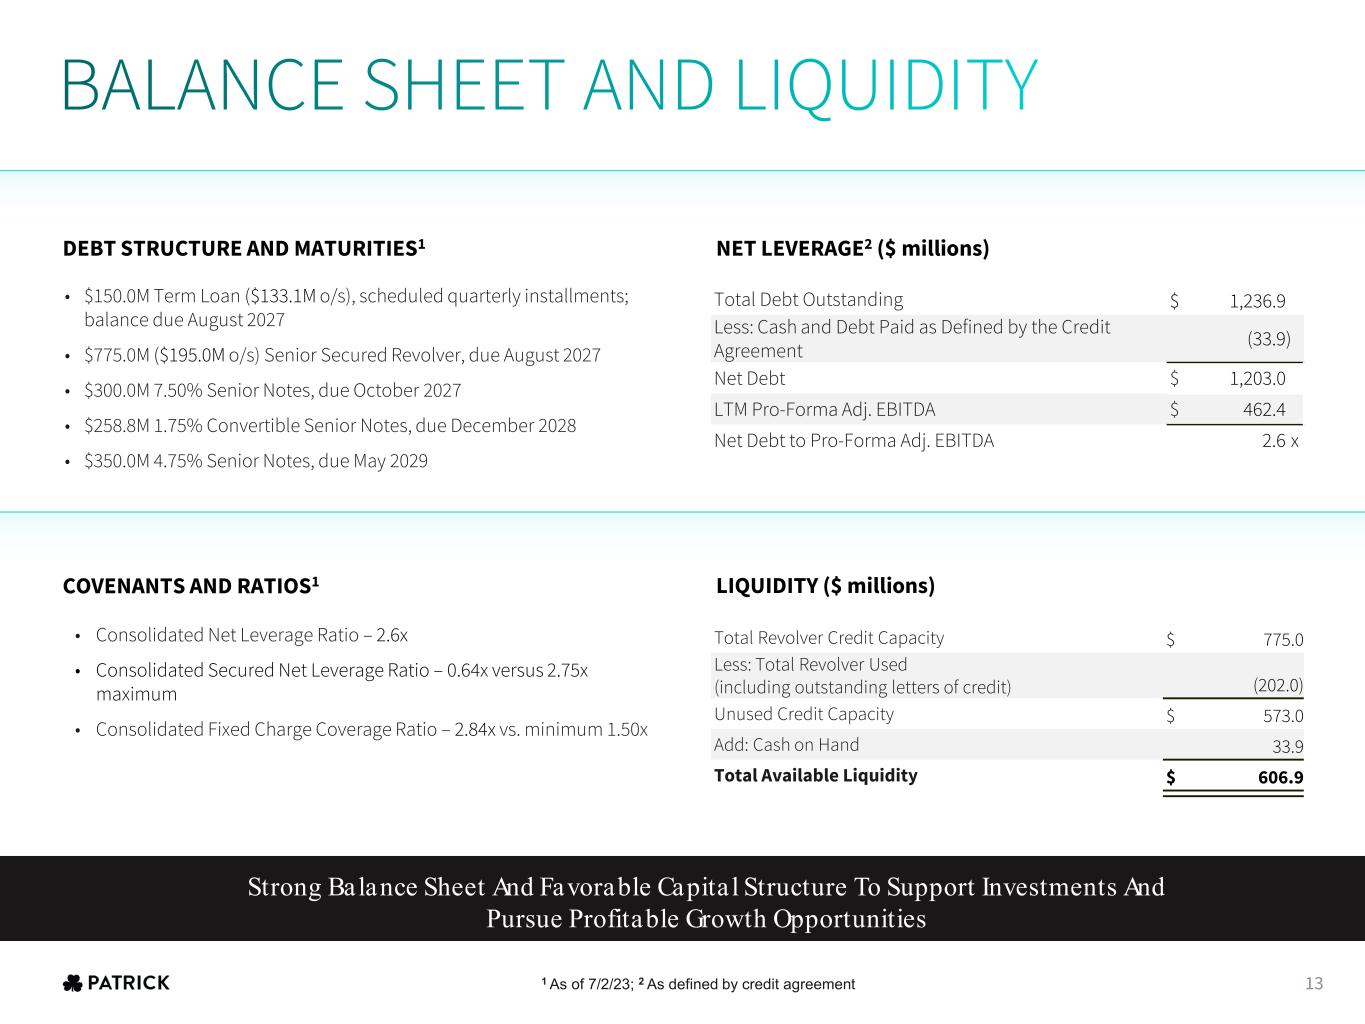
• $150.0M Term Loan ($133.1M o/s), scheduled quarterly installments; balance due August 2027 • $775.0M ($195.0M o/s) Senior Secured Revolver, due August 2027 • $300.0M 7.50% Senior Notes, due October 2027 • $258.8M 1.75% Convertible Senior Notes, due December 2028 • $350.0M 4.75% Senior Notes, due May 2029 Total Debt Outstanding $ 1,236.9 Less: Cash and Debt Paid as Defined by the Credit Agreement (33.9) Net Debt $ 1,203.0 LTM Pro-Forma Adj. EBITDA $ 462.4 Net Debt to Pro-Forma Adj. EBITDA 2.6 x Total Revolver Credit Capacity $ 775.0 Less: Total Revolver Used (including outstanding letters of credit) (202.0) Unused Credit Capacity $ 573.0 Add: Cash on Hand 33.9 Total Available Liquidity $ 606.9 • Consolidated Net Leverage Ratio – 2.6x • Consolidated Secured Net Leverage Ratio – 0.64x versus 2.75x maximum • Consolidated Fixed Charge Coverage Ratio – 2.84x vs. minimum 1.50x COVENANTS AND RATIOS1 DEBT STRUCTURE AND MATURITIES1 NET LEVERAGE2 ($ millions) LIQUIDITY ($ millions) 1 As of 7/2/23; 2 As defined by credit agreement Strong Balance Sheet And Favorable Capita l Structure To Support Investments And Pursue Profitable Growth Opportunities 13
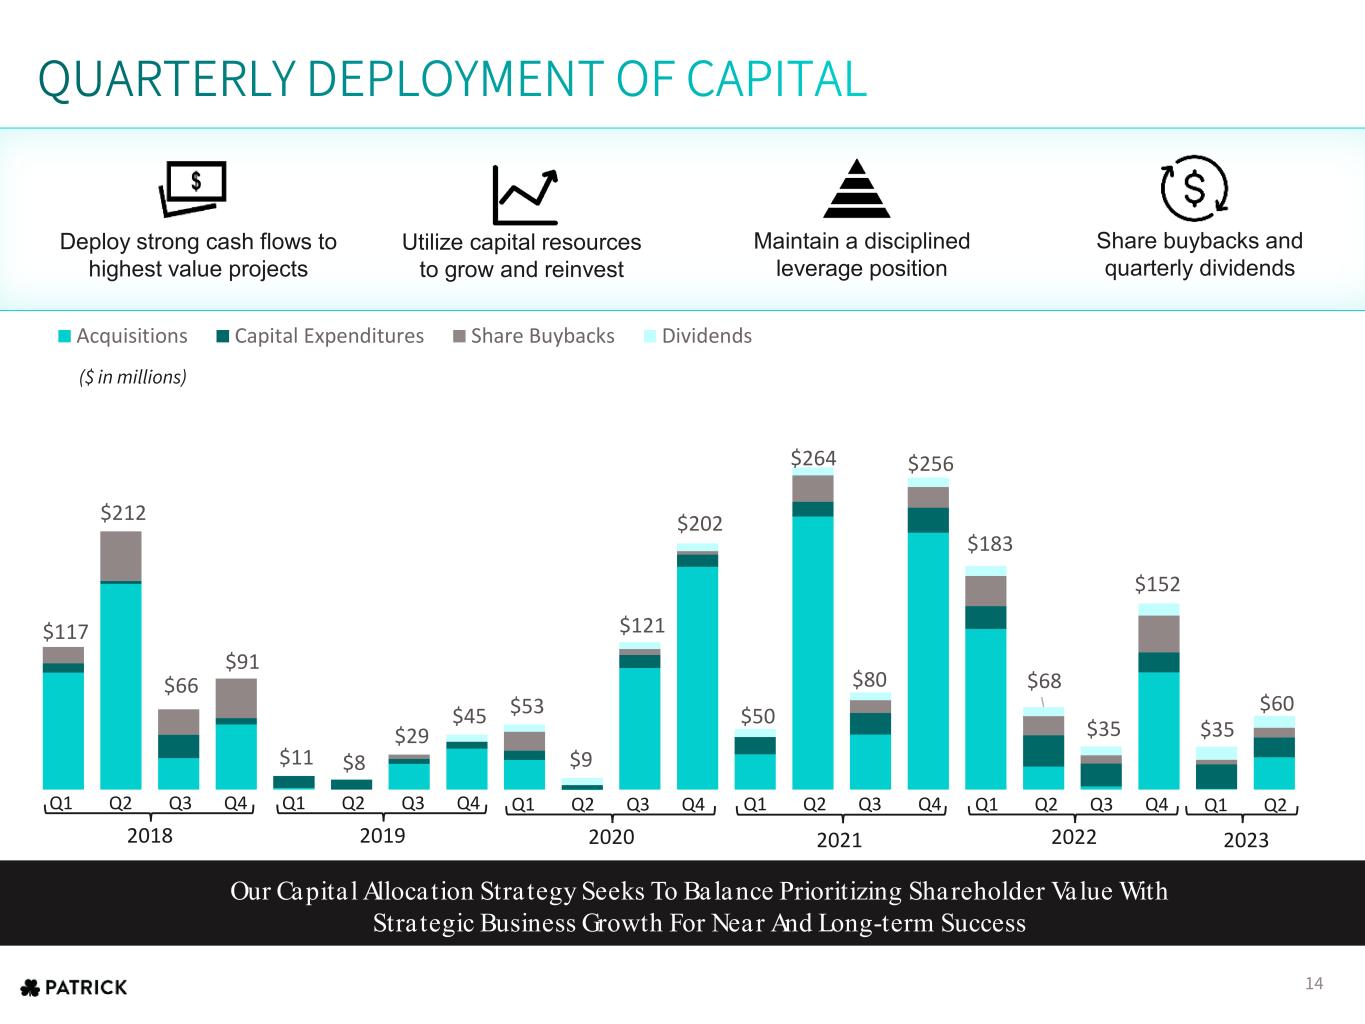
$117 $212 $66 $91 $11 $8 $29 $45 $53 $9 $121 $202 $50 $264 $80 $256 $183 $68 $35 $152 $35 $60 Acquisitions Capital Expenditures Share Buybacks Dividends ($ in millions) Our Capita l Allocation Stra tegy Seeks To Balance Prioritizing Shareholder Value With Stra tegic Business Growth For Near And Long-term Success Deploy strong cash flows to highest value projects Maintain a disciplined leverage position Utilize capital resources to grow and reinvest Share buybacks and quarterly dividends 2022 Q1 Q2 Q3 Q4 2021 Q1 Q2 Q3 Q4 Q1 Q2 20232020 Q1 Q2 Q3 Q4 2019 Q1 Q2 Q3 Q4 2018 Q1 Q2 Q3 Q4 14
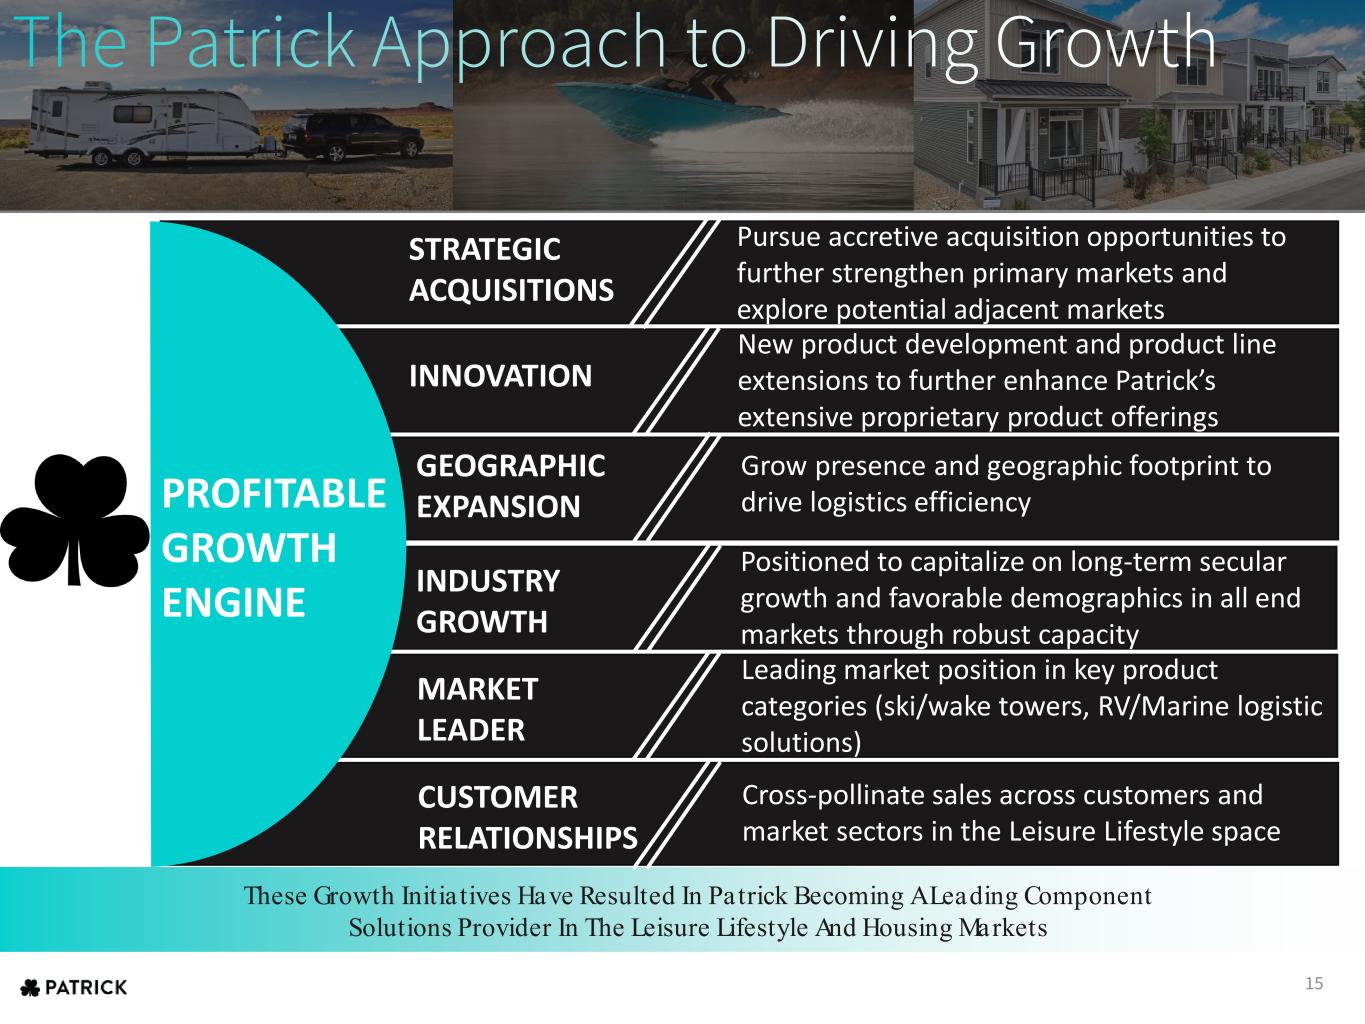
These Growth Initia tives Have Resulted In Patrick Becoming A Leading Component Solutions Provider In The Leisure Lifestyle And Housing Markets PROFITABLE GROWTH ENGINE STRATEGIC ACQUISITIONS Pursue accretive acquisition opportunities to further strengthen primary markets and explore potential adjacent markets INNOVATION New product development and product line extensions to further enhance Patrick’s extensive proprietary product offerings GEOGRAPHIC EXPANSION Grow presence and geographic footprint to drive logistics efficiency INDUSTRY GROWTH Positioned to capitalize on long-term secular growth and favorable demographics in all end markets through robust capacity MARKET LEADER Leading market position in key product categories (ski/wake towers, RV/Marine logistic solutions) CUSTOMER RELATIONSHIPS Cross-pollinate sales across customers and market sectors in the Leisure Lifestyle space 15
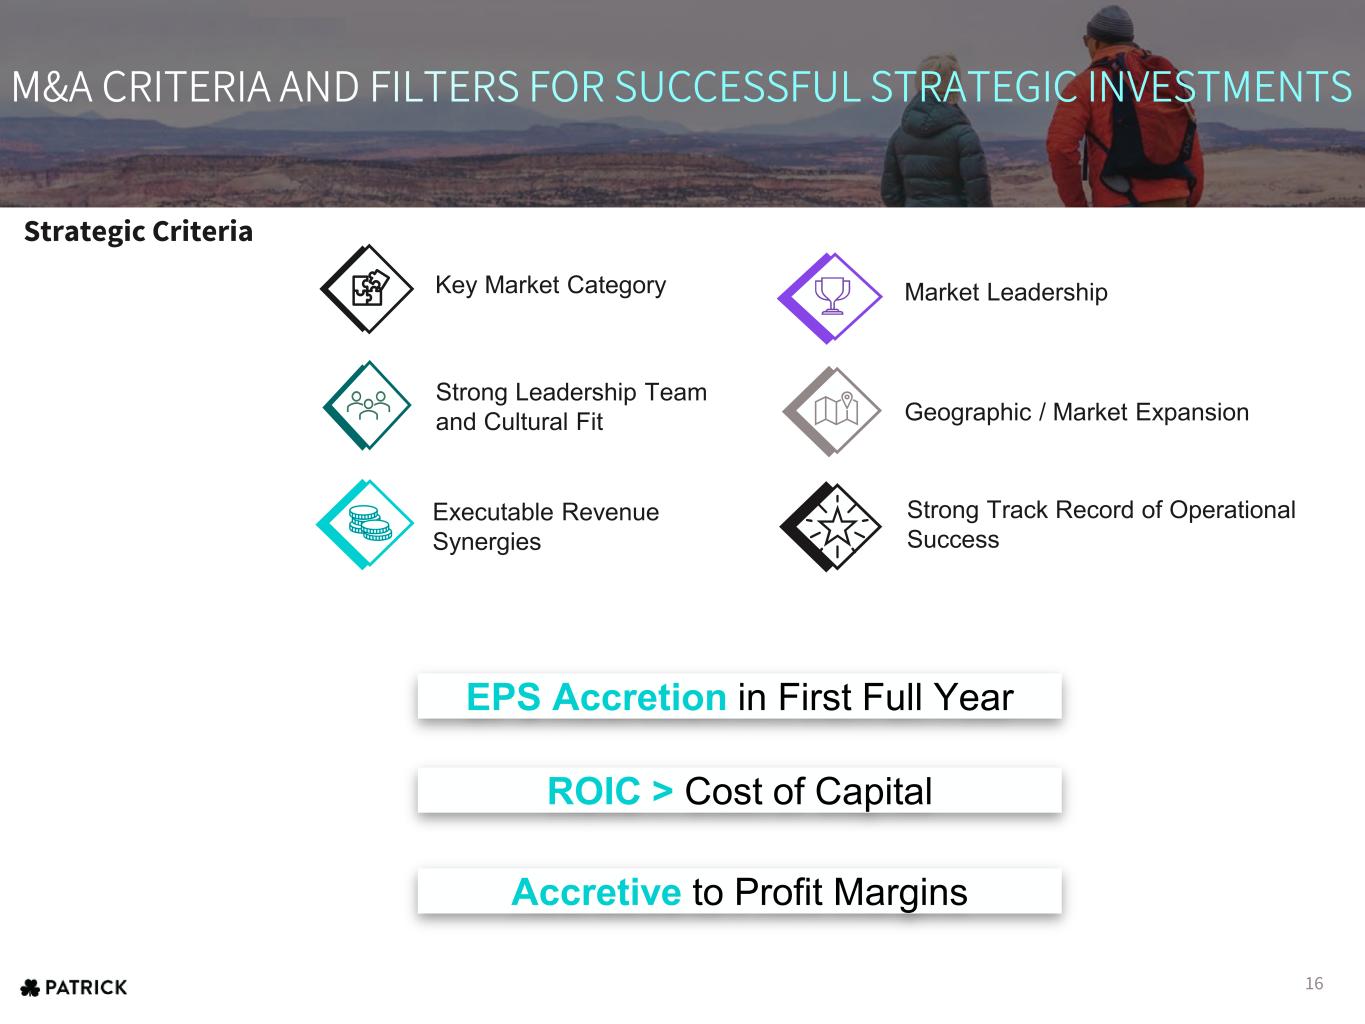
Strategic Criteria Strong Leadership Team and Cultural Fit Executable Revenue Synergies Geographic / Market Expansion Market Leadership Strong Track Record of Operational Success Key Market Category EPS Accretion in First Full Year ROIC > Cost of Capital Accretive to Profit Margins 16

17 BALANCE We work to build a healthy work environment that encourages excellence, happiness, and peace in both our work and our home life. EXCELLENCE We strive to meet the highest possible standards of achievement in our work and relationships. TRUST We do what we say we will do every time — and communicate with all stakeholders if a commitment evolves. TEAMWORK We challenge, encourage, equip, empower, and inspire the individuals we work with. EMPOWERMENT We give our team members the information, tools and trust they need to grow as leaders and achieve results. RESPECT We treat our teammates and partners with the utmost honor and dignity. OUR VALUES 17

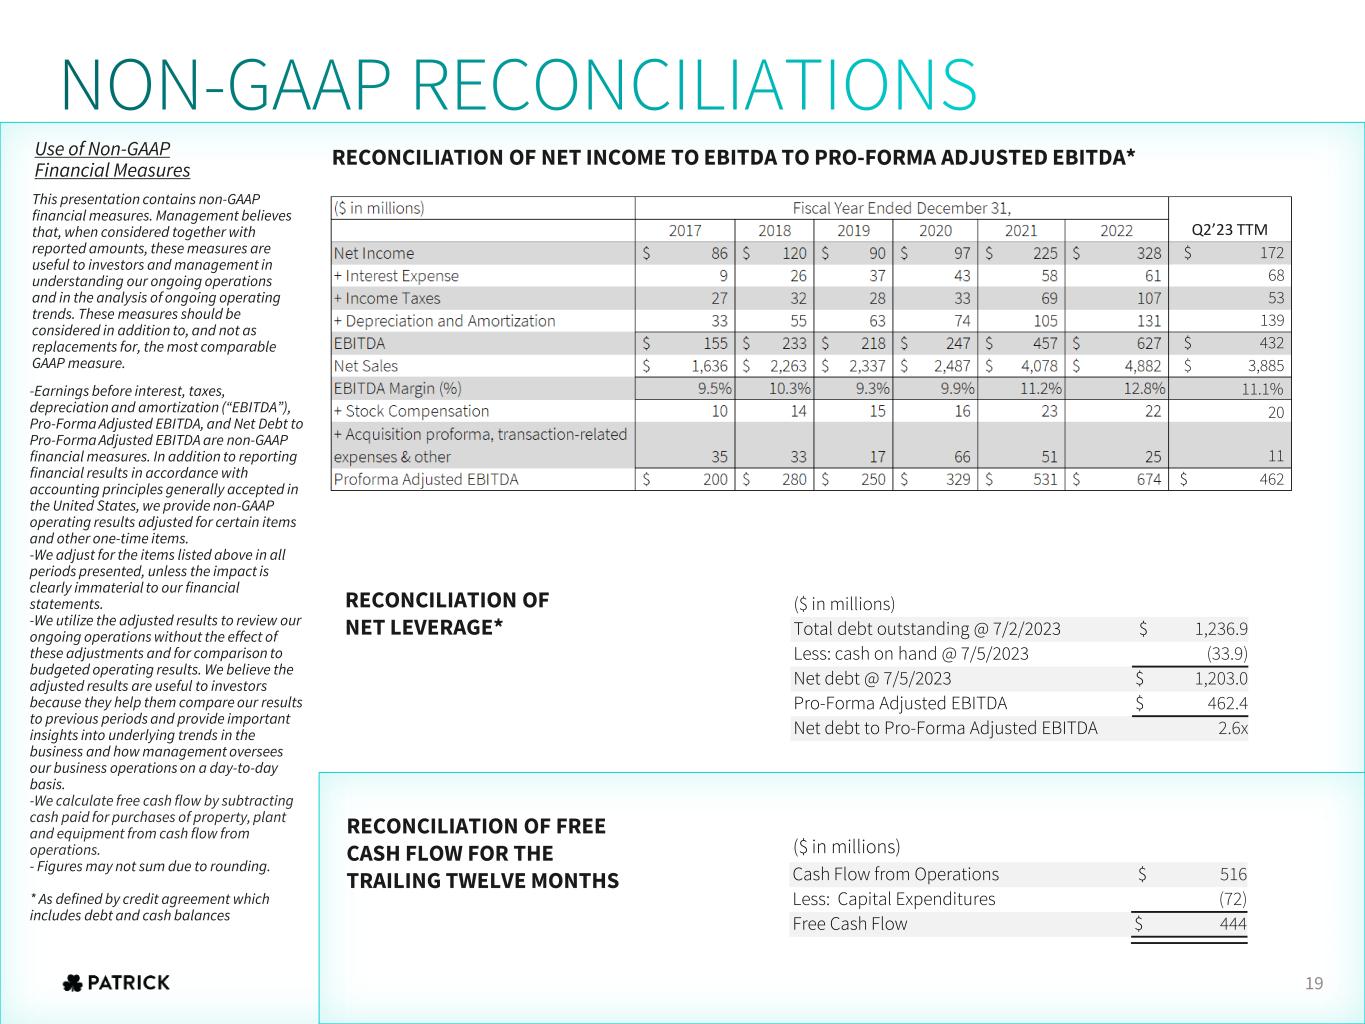
RECONCILIATION OF NET LEVERAGE* -Earnings before interest, taxes, depreciation and amortization (“EBITDA”), Pro-Forma Adjusted EBITDA, and Net Debt to Pro-Forma Adjusted EBITDA are non-GAAP financial measures. In addition to reporting financial results in accordance with accounting principles generally accepted in the United States, we provide non-GAAP operating results adjusted for certain items and other one-time items. -We adjust for the items listed above in all periods presented, unless the impact is clearly immaterial to our financial statements. -We utilize the adjusted results to review our ongoing operations without the effect of these adjustments and for comparison to budgeted operating results. We believe the adjusted results are useful to investors because they help them compare our results to previous periods and provide important insights into underlying trends in the business and how management oversees our business operations on a day-to-day basis. -We calculate free cash flow by subtracting cash paid for purchases of property, plant and equipment from cash flow from operations. - Figures may not sum due to rounding. * As defined by credit agreement which includes debt and cash balances RECONCILIATION OF NET INCOME TO EBITDA TO PRO-FORMA ADJUSTED EBITDA* RECONCILIATION OF FREE CASH FLOW FOR THE TRAILING TWELVE MONTHS $ 172 68 53 139 $ 432 $ 3,885 20 11 $ 462 Q2’23 TTM ($ in millions) Total debt outstanding @ 7/2/2023 $ 1,236.9 Less: cash on hand @ 7/5/2023 (33.9) Net debt @ 7/5/2023 $ 1,203.0 Pro-Forma Adjusted EBITDA $ 462.4 Net debt to Pro-Forma Adjusted EBITDA 2.6x Cash Flow from Operations $ 516 Less: Capital Expenditures (72) Free Cash Flow $ 444 11.1% ($ in millions) 19 Use of Non-GAAP Financial Measures This presentation contains non-GAAP financial measures. Management believes that, when considered together with reported amounts, these measures are useful to investors and management in understanding our ongoing operations and in the analysis of ongoing operating trends. These measures should be considered in addition to, and not as replacements for, the most comparable GAAP measure.

Single-Section Homes Multi-Section Homes ASP: $72,600 | 42% of Market ASP: $132,000 | 58% of Market TOWABLE Shipments: 88% Wholesale | 65% Retail Value MOTORIZED Shipments: 12% Wholesale | 35% Retail Value Travel Trailer | ASP: $32,100 Fifth Wheel | ASP: $74,200 Class A | ASP: $257,800 Class B & C | ASP: $130,800 RV PRODUCT CATEGORIES1 Pontoon Ski & Wake Fiberglass Aluminum ASP: $55,000 | 33% of Market ASP: $130,000 | 7% of Market ASP: $101,000 | 37% of Market ASP: $31,900 | 23% of Market U.S Expenditures on Boats, Engines, and Accessories Totaled $xxB in 2019 MARINE PRODUCT CATEGORIES2 MANUFACTURED HOUSING PRODUCT CATEGORIES3 1 Source: RVIA 2022 Industry profile (travel trailer ASPs & stats include camping trailers and truck campers) | 2 Source: NMMA 2021 Statistical Abstract | 3 Source: Manufactured Housing Institute 20
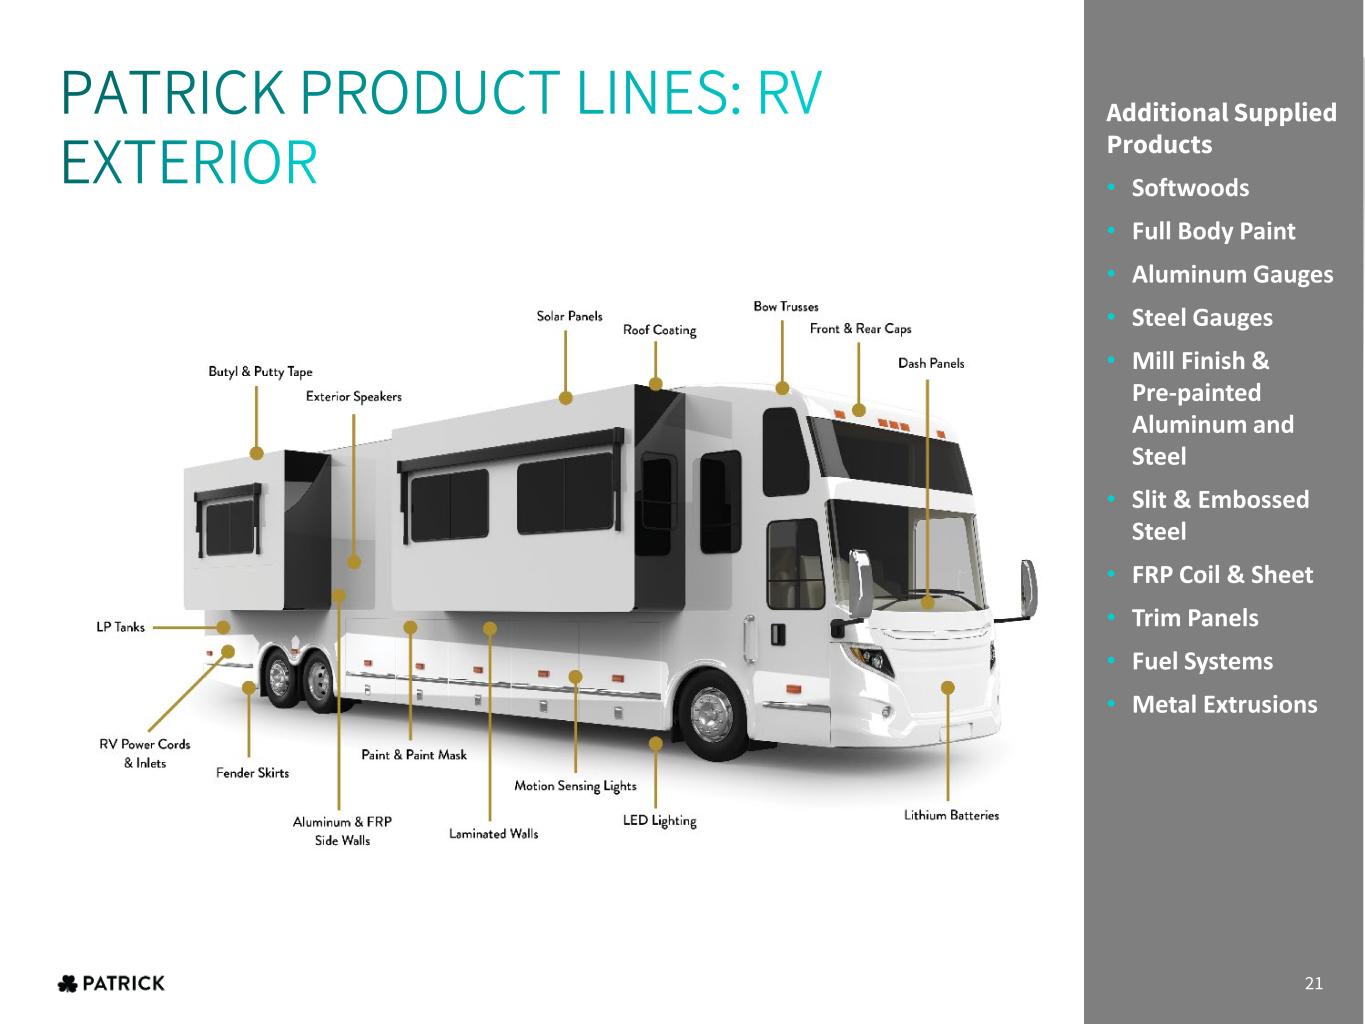
Additional Supplied Products • Softwoods • Full Body Paint • Aluminum Gauges • Steel Gauges • Mill Finish & Pre-painted Aluminum and Steel • Slit & Embossed Steel • FRP Coil & Sheet • Trim Panels • Fuel Systems • Metal Extrusions 21
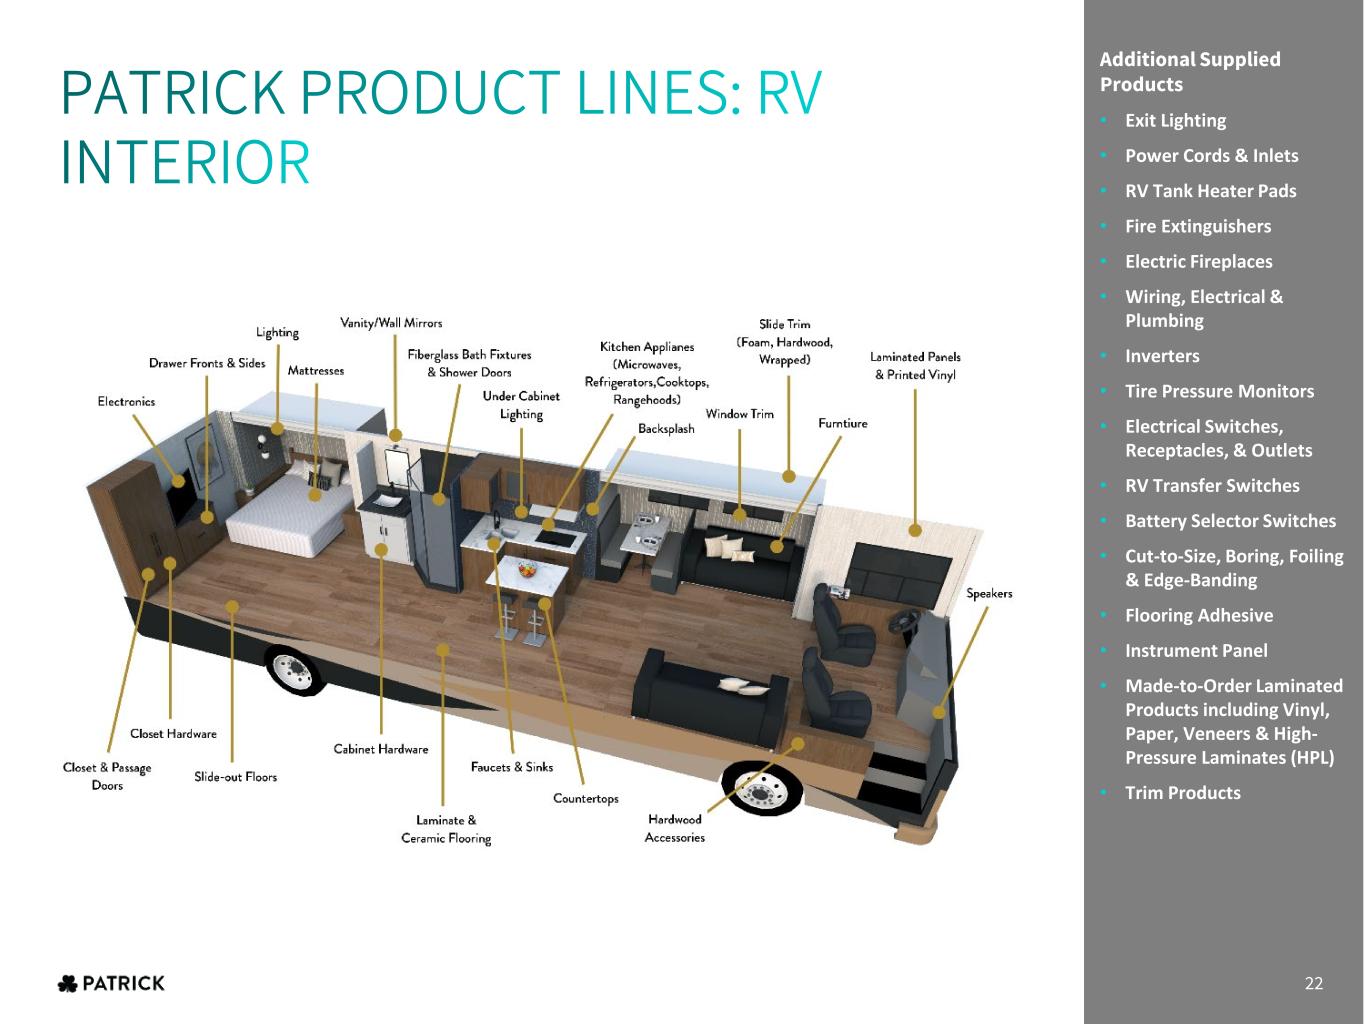
Additional Supplied Products • Exit Lighting • Power Cords & Inlets • RV Tank Heater Pads • Fire Extinguishers • Electric Fireplaces • Wiring, Electrical & Plumbing • Inverters • Tire Pressure Monitors • Electrical Switches, Receptacles, & Outlets • RV Transfer Switches • Battery Selector Switches • Cut-to-Size, Boring, Foiling & Edge-Banding • Flooring Adhesive • Instrument Panel • Made-to-Order Laminated Products including Vinyl, Paper, Veneers & High- Pressure Laminates (HPL) • Trim Products 22
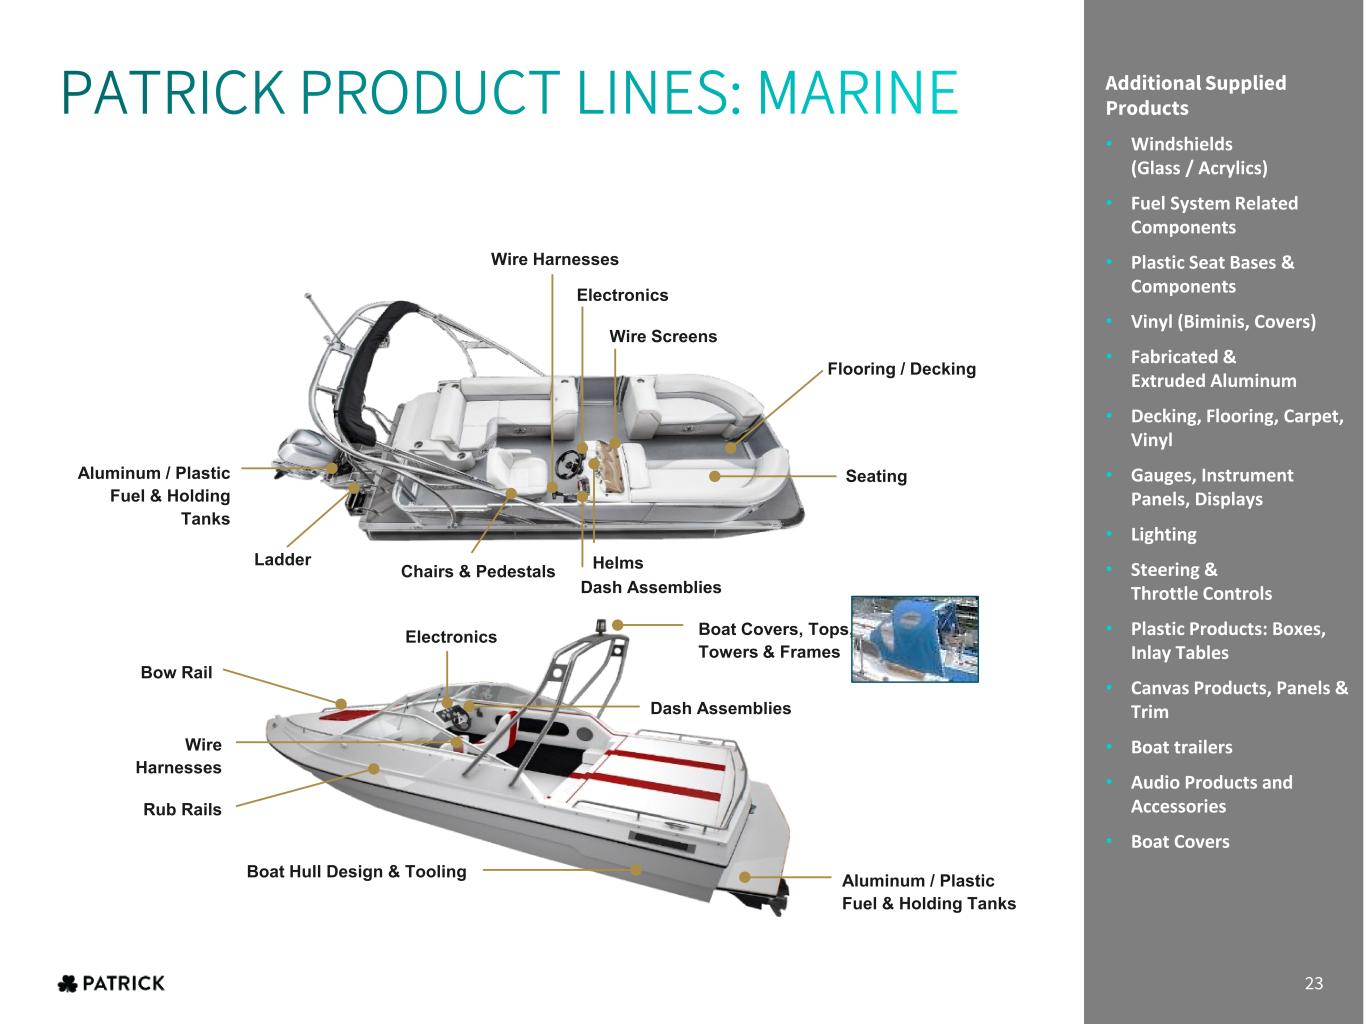
Additional Supplied Products Softwoods Full Body Paint Aluminum Gauges Steel Gauges Mill Finish & Pre-painted Aluminum and Steel Slit & Embossed Steel FRP Coil & Sheet Trim Panels Fuel Systems Metal Extrusions Aluminum / Plastic Fuel & Holding Tanks Wire Harnesses Electronics Dash Assemblies Wire Screens Helms Aluminum / Plastic Fuel & Holding Tanks Boat Hull Design & Tooling Wire Harnesses Dash Assemblies Electronics Boat Covers, Tops, Towers & Frames Ladder Chairs & Pedestals Rub Rails Bow Rail Flooring / Decking Seating Additional Supplied Products • Windshields (Glass / Acrylics) • Fuel System Related Components • Plastic Seat Bases & Components • Vinyl (Biminis, Covers) • Fabricated & Extruded Aluminum • Decking, Flooring, Carpet, Vinyl • Gauges, Instrument Panels, Displays • Lighting • Steering & Throttle Controls • Plastic Products: Boxes, Inlay Tables • Canvas Products, Panels & Trim • Boat trailers • Audio Products and Accessories • Boat Covers 23
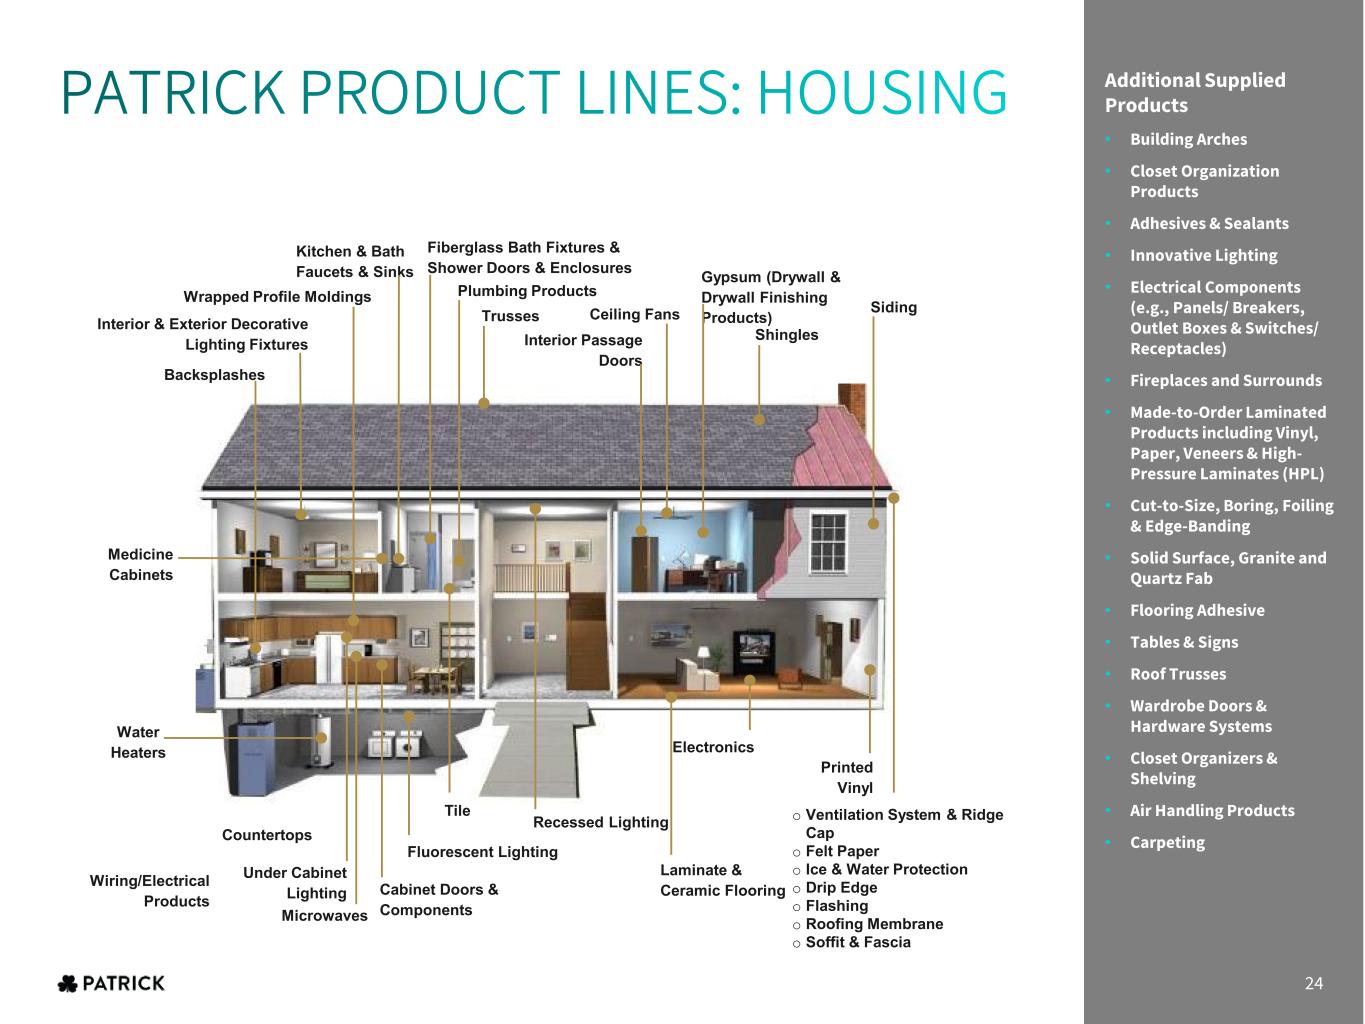
Additional Supplied Products Softwoods Full Body Paint Aluminum Gauges Steel Gauges Mill Finish & Pre-painted Aluminum and Steel Slit & Embossed Steel FRP Coil & Sheet Trim Panels Fuel Systems Metal Extrusions Interior Passage Doors Kitchen & Bath Faucets & Sinks Gypsum (Drywall & Drywall Finishing Products) Laminate & Ceramic Flooring Fiberglass Bath Fixtures & Shower Doors & Enclosures Cabinet Doors & ComponentsMicrowaves Countertops Electronics Siding Shingles o Ventilation System & Ridge Cap o Felt Paper o Ice & Water Protection o Drip Edge o Flashing o Roofing Membrane o Soffit & Fascia Wrapped Profile Moldings Plumbing Products Backsplashes Recessed Lighting Fluorescent Lighting Wiring/Electrical Products Ceiling Fans Medicine Cabinets Under Cabinet Lighting Tile Printed Vinyl TrussesInterior & Exterior Decorative Lighting Fixtures Water Heaters Additional Supplied Products • Building Arches • Closet Organization Products • Adhesives & Sealants • Innovative Lighting • Electrical Components (e.g., Panels/ Breakers, Outlet Boxes & Switches/ Receptacles) • Fireplaces and Surrounds • Made-to-Order Laminated Products including Vinyl, Paper, Veneers & High- Pressure Laminates (HPL) • Cut-to-Size, Boring, Foiling & Edge-Banding • Solid Surfac , Granite and Quartz Fab • Flooring Adhesive • Tables & Signs • Roof Trusses • Wardrobe Doors & Hardware Systems • Closet Organizers & Shelving • Air Handling Products • Carpeting 24