EX-99.2
Published on October 7, 2024

Investor Presentation October 7th, 2024
This presentation includes contains statements that are “forward-looking statements” within the meaning of the Private Securities Litigation Reform Act of 1995. Forward-looking statements are generally identified by words such as “estimates,” “guidance,” “expects,” ”anticipates,” “intends,” “plans,” “believes,” “seeks,” “likely” and similar expressions. Forward- looking statements include information with respect to financial condition, results of operations, business strategies, operating efficiencies or synergies, competitive position, industry projections, growth opportunities, acquisitions, plans and objectives of management, markets for the common stock and other matters. These forward-looking statements involve a number of risks and uncertainties that could cause actual results to differ materially from either historical or anticipated results depending on a variety of factors. These risks and uncertainties include, in addition to other matters described in this presentation, the impacts of future pandemics, geopolitical tensions or natural disaster, on the overall economy, our sales, customers, operations, team members and suppliers. Further information concerning the Company and its business, including risk factors that potentially could materially affect the Company’s financial results are discussed under the caption “Risk Factors” in the Company’s Annual Report on Form 10-K for the year ended December 31, 2023, filed with the Securities and Exchange Commission on February 29, 2024. We caution readers not to place undue reliance on forward-looking statements. Forward- looking statements speak only as of the date they are made, and we disclaim any obligation or undertaking to disseminate any updates or revisions to any forward-looking statements contained in this presentation or to reflect any change in our expectations after the date of this presentation or any change in events, conditions or circumstances on which any statement is based. USE OF NON-GAAP FINANCIAL MEASURES This presentation contains non-GAAP financial measures. These measures, the purposes for which management uses them, why management believes they are useful to investors, and a reconciliation to the most directly comparable GAAP financial measures can be found in the Appendix of this presentation. Forward-Looking Statements 2
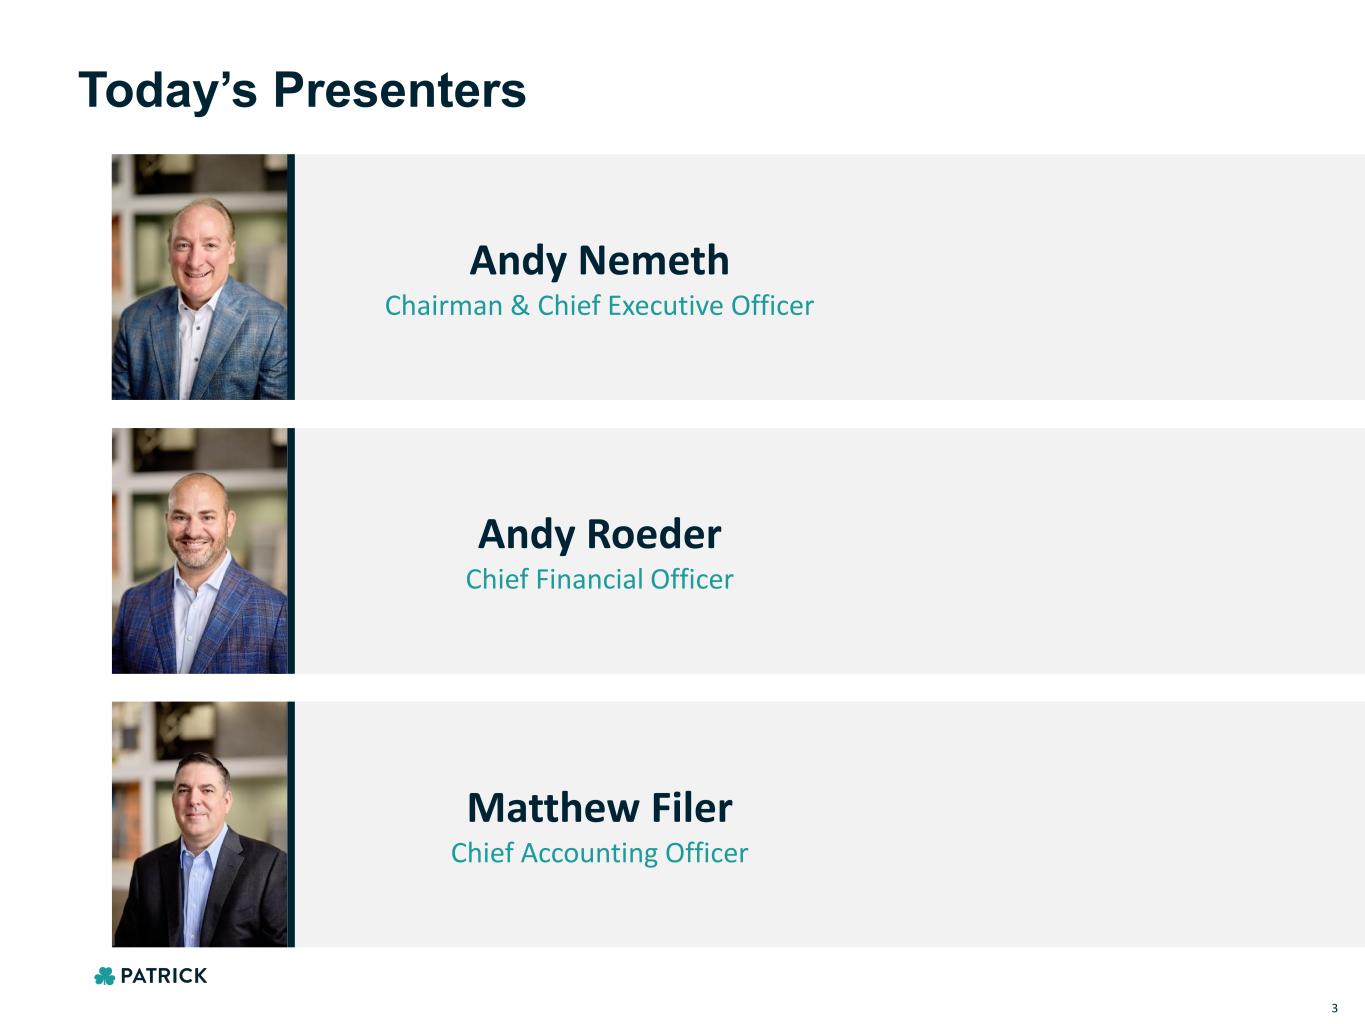
Today’s Presenters Andy Nemeth Chairman & Chief Executive Officer Andy Roeder Chief Financial Officer 3 Matthew Filer Chief Accounting Officer

Company Overview
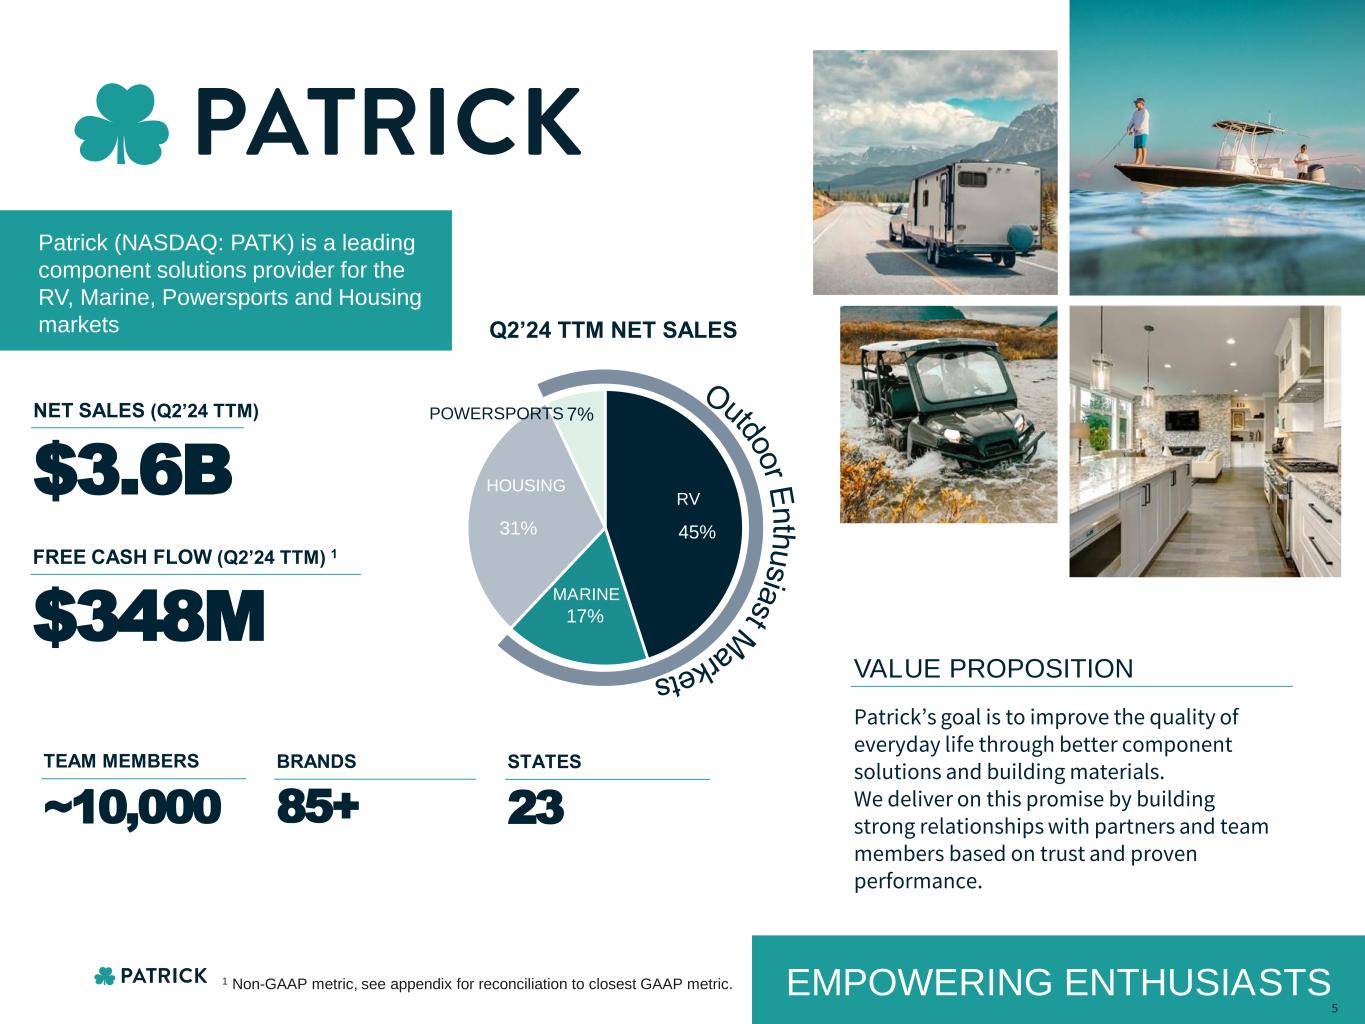
EMPOWERING ENTHUSIASTS Outdoo r E n th u sia stM arkets 5 Q2’24 TTM NET SALES 45% 17% 31% 7%POWERSPORTS RV HOUSING MARINE ~10,000 TEAM MEMBERS BRANDS 85+ STATES 23 NET SALES (Q2’24 TTM) $3.6B VALUE PROPOSITION Patrick (NASDAQ: PATK) is a leading component solutions provider for the RV, Marine, Powersports and Housing markets Patrick’s goal is to improve the quality of everyday life through better component solutions and building materials. We deliver on this promise by building strong relationships with partners and team members based on trust and proven performance. FREE CASH FLOW (Q2’24 TTM) 1 $348M 1 Non-GAAP metric, see appendix for reconciliation to closest GAAP metric.
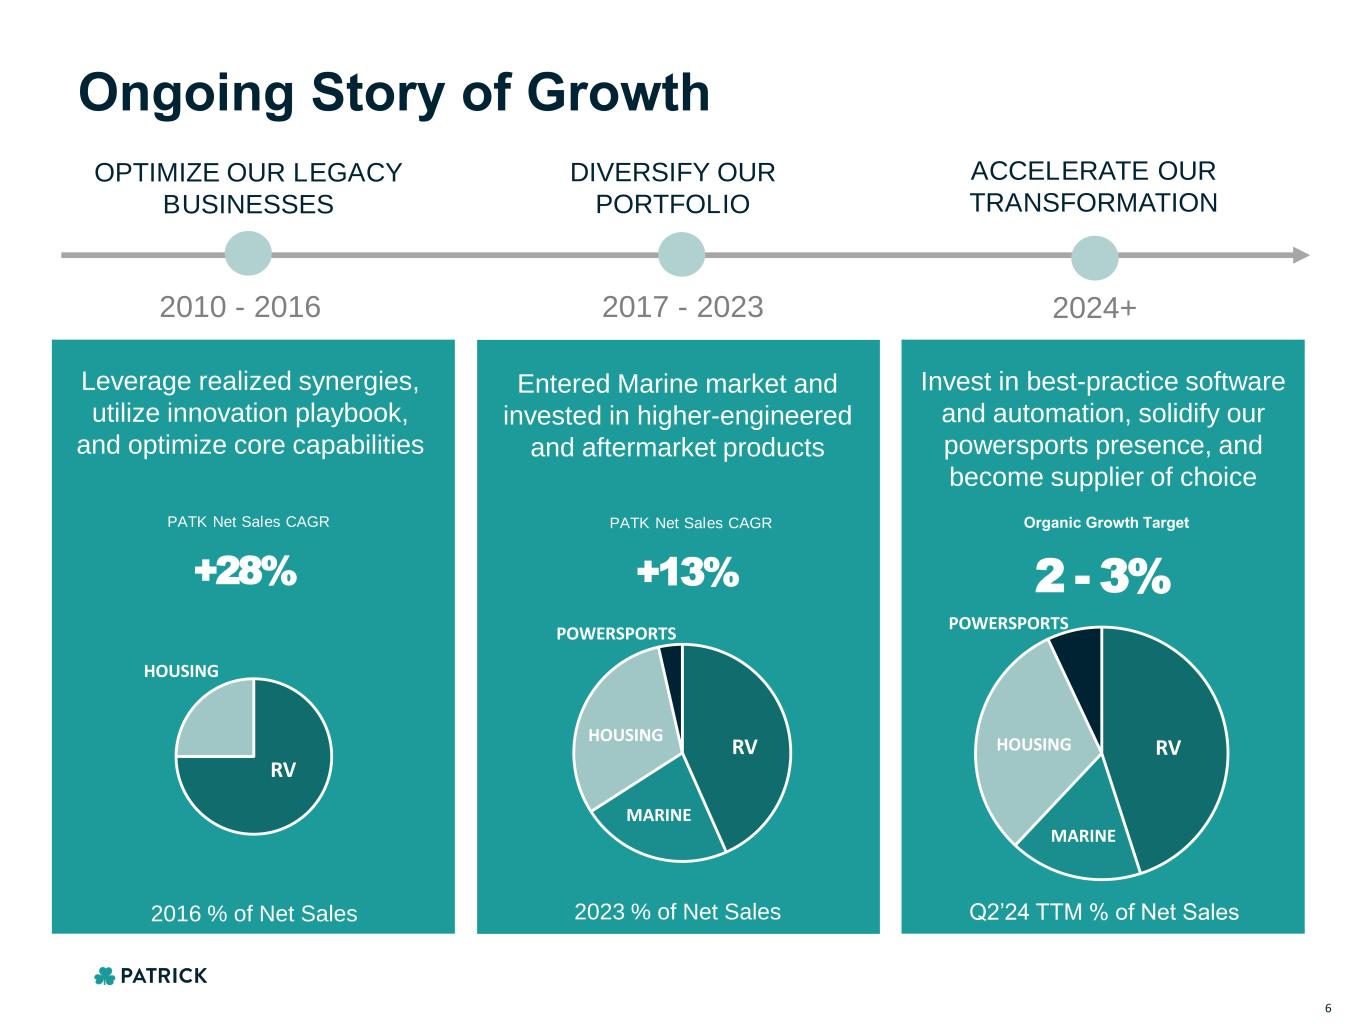
6 2010 - 2016 2017 - 2023 2024+ OPTIMIZE OUR LEGACY BUSINESSES DIVERSIFY OUR PORTFOLIO ACCELERATE OUR TRANSFORMATION Leverage realized synergies, utilize innovation playbook, and optimize core capabilities +28% PATK Net Sales CAGR Entered Marine market and invested in higher-engineered and aftermarket products Invest in best-practice software and automation, solidify our powersports presence, and become supplier of choice 2 - 3% Organic Growth Target +13% PATK Net Sales CAGR RV HOUSING RVHOUSING MARINE 2016 % of Net Sales 2023 % of Net Sales Q2’24 TTM % of Net Sales RV HOUSING MARINE POWERSPORTS POWERSPORTS Ongoing Story of Growth
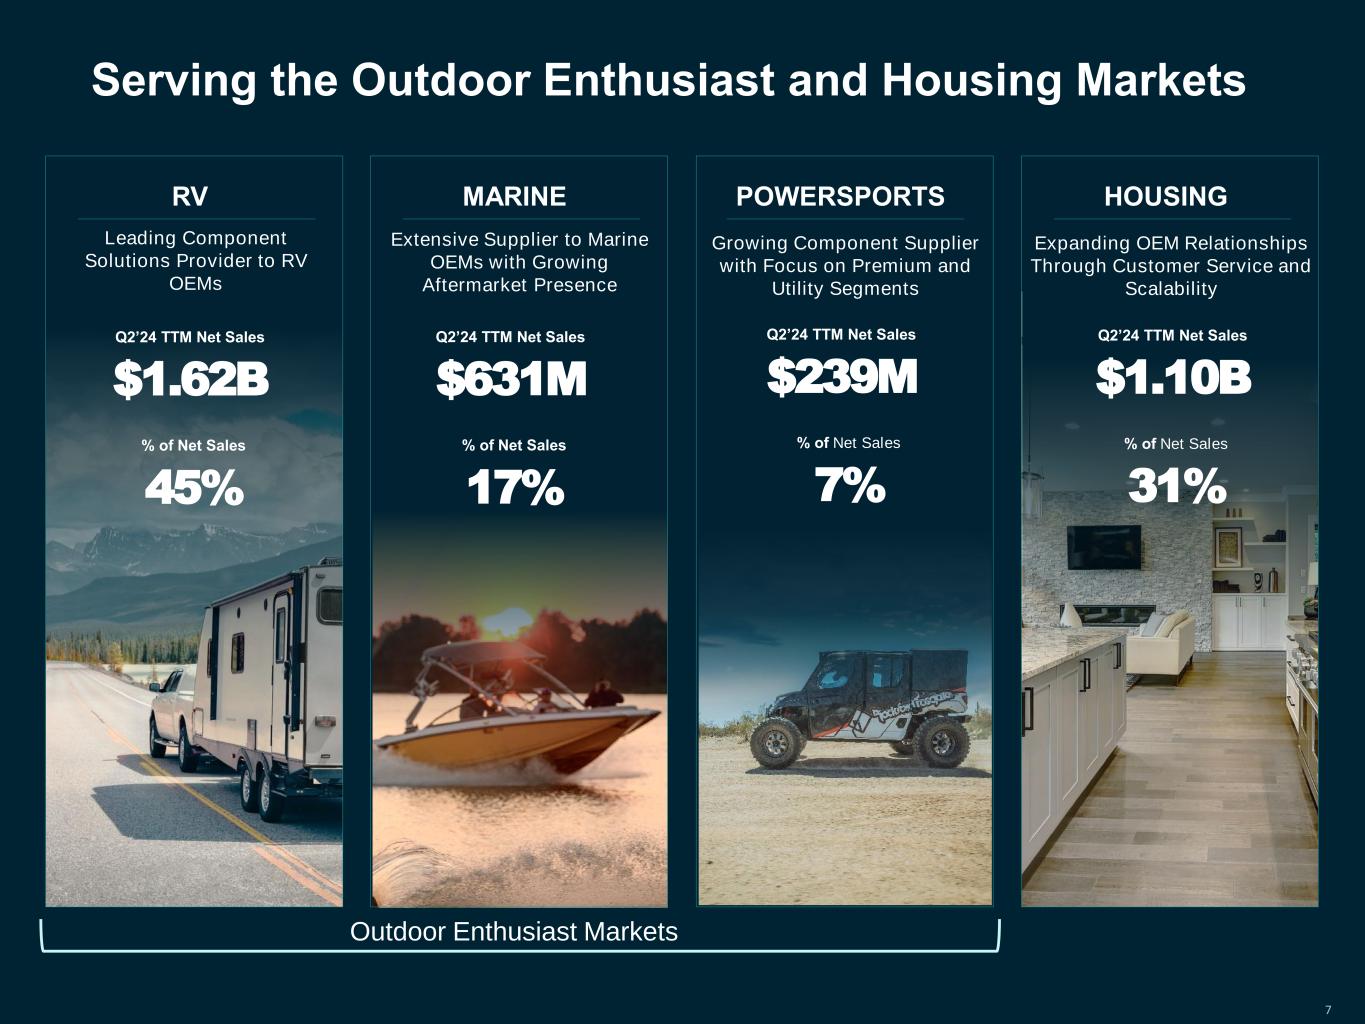
7 Serving the Outdoor Enthusiast and Housing Markets POWERSPORTSRV HOUSING Leading Component Solutions Provider to RV OEMs $1.62B Q2’24 TTM Net Sales 45% % of Net Sales $239M Q2’24 TTM Net Sales 7% % of Net Sales Expanding OEM Relationships Through Customer Service and Scalability $1.10B Q2’24 TTM Net Sales 31% % of Net Sales Growing Component Supplier with Focus on Premium and Utility Segments MARINE Extensive Supplier to Marine OEMs with Growing Aftermarket Presence $631M Q2’24 TTM Net Sales 17% % of Net Sales Outdoor Enthusiast Markets
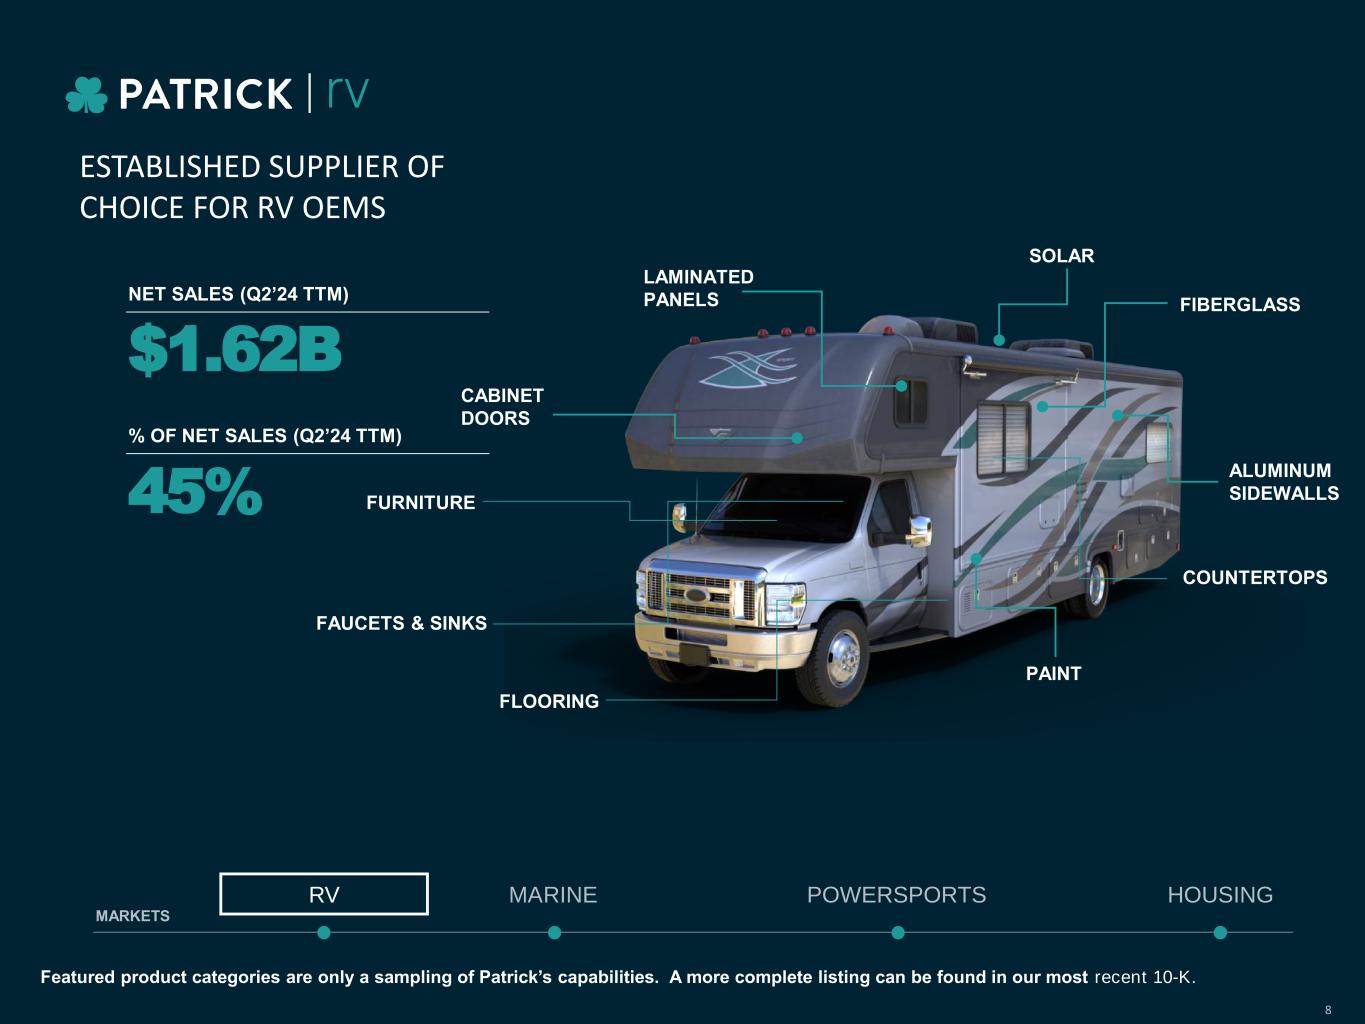
ESTABLISHED SUPPLIER OF CHOICE FOR RV OEMS MARINE POWERSPORTS HOUSINGRV MARKETS $1.62B NET SALES (Q2’24 TTM) % OF NET SALES (Q2’24 TTM) 45% CABINET DOORS FURNITURE PAINT ALUMINUM SIDEWALLS FIBERGLASS FLOORING LAMINATED PANELS FAUCETS & SINKS SOLAR COUNTERTOPS Featured product categories are only a sampling of Patrick’s capabilities. A more complete listing can be found in our most recent 10-K. 8
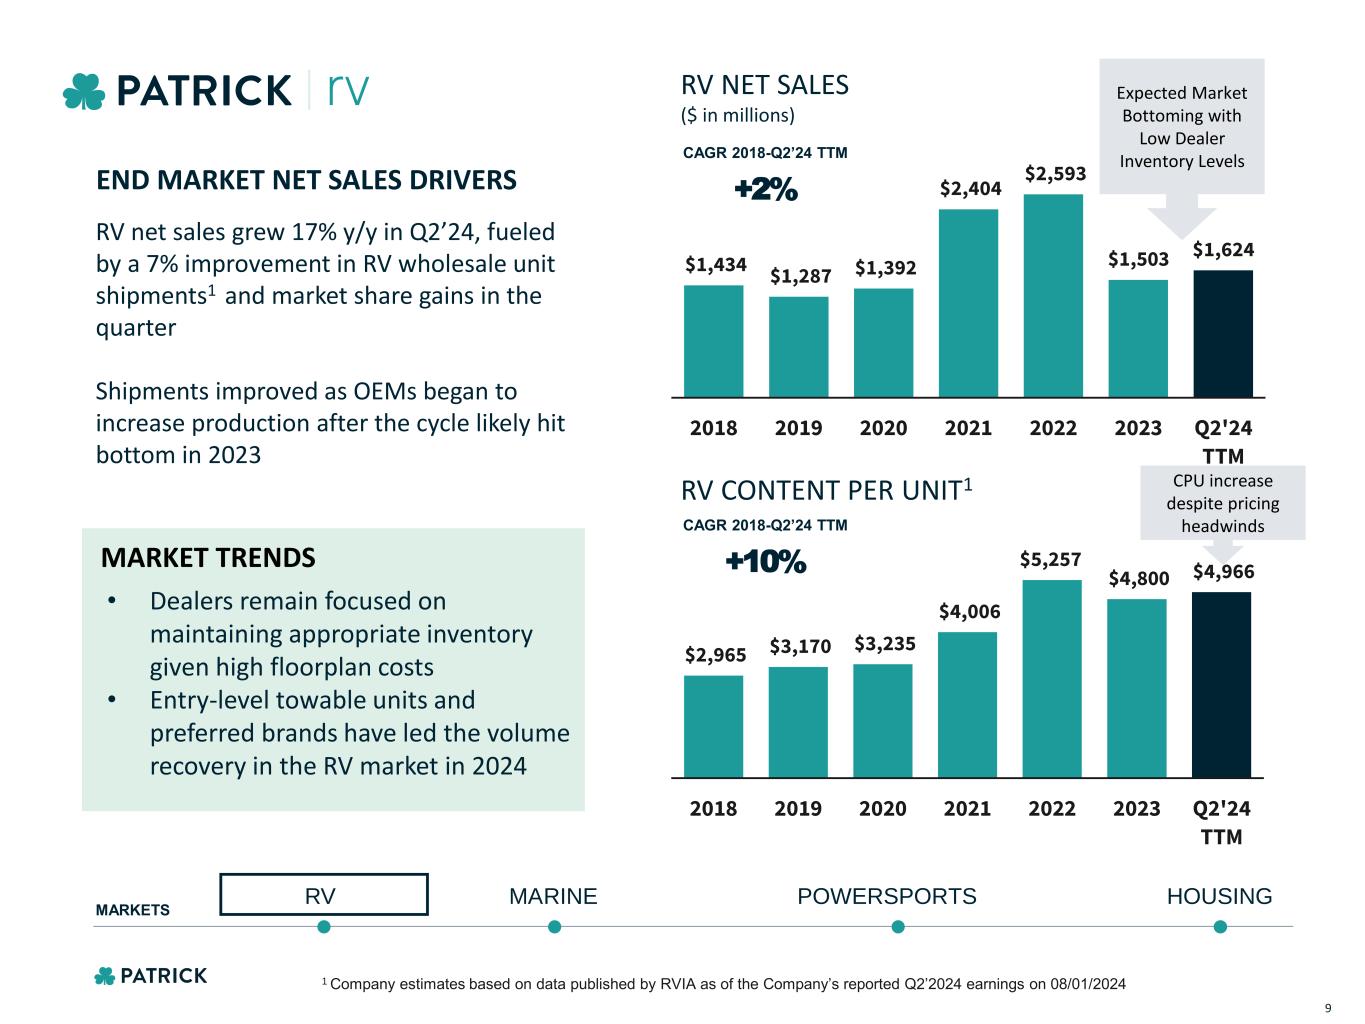
POWERSPORTSMARINE HOUSINGRV MARKETS $1,434 $1,287 $1,392 $2,404 $2,593 $1,503 $1,624 2018 2019 2020 2021 2022 2023 Q2'24 TTM RV NET SALES ($ in millions) +2% CAGR 2018-Q2’24 TTM END MARKET NET SALES DRIVERS RV net sales grew 17% y/y in Q2’24, fueled by a 7% improvement in RV wholesale unit shipments1 and market share gains in the quarter Shipments improved as OEMs began to increase production after the cycle likely hit bottom in 2023 MARKET TRENDS • Dealers remain focused on maintaining appropriate inventory given high floorplan costs • Entry-level towable units and preferred brands have led the volume recovery in the RV market in 2024 $2,965 $3,170 $3,235 $4,006 $5,257 $4,800 $4,966 2018 2019 2020 2021 2022 2023 Q2'24 TTM RV CONTENT PER UNIT1 +10% CAGR 2018-Q2’24 TTM Expected Market Bottoming with Low Dealer Inventory Levels 1 Company estimates based on data published by RVIA as of the Company’s reported Q2’2024 earnings on 08/01/2024 CPU increase despite pricing headwinds 9
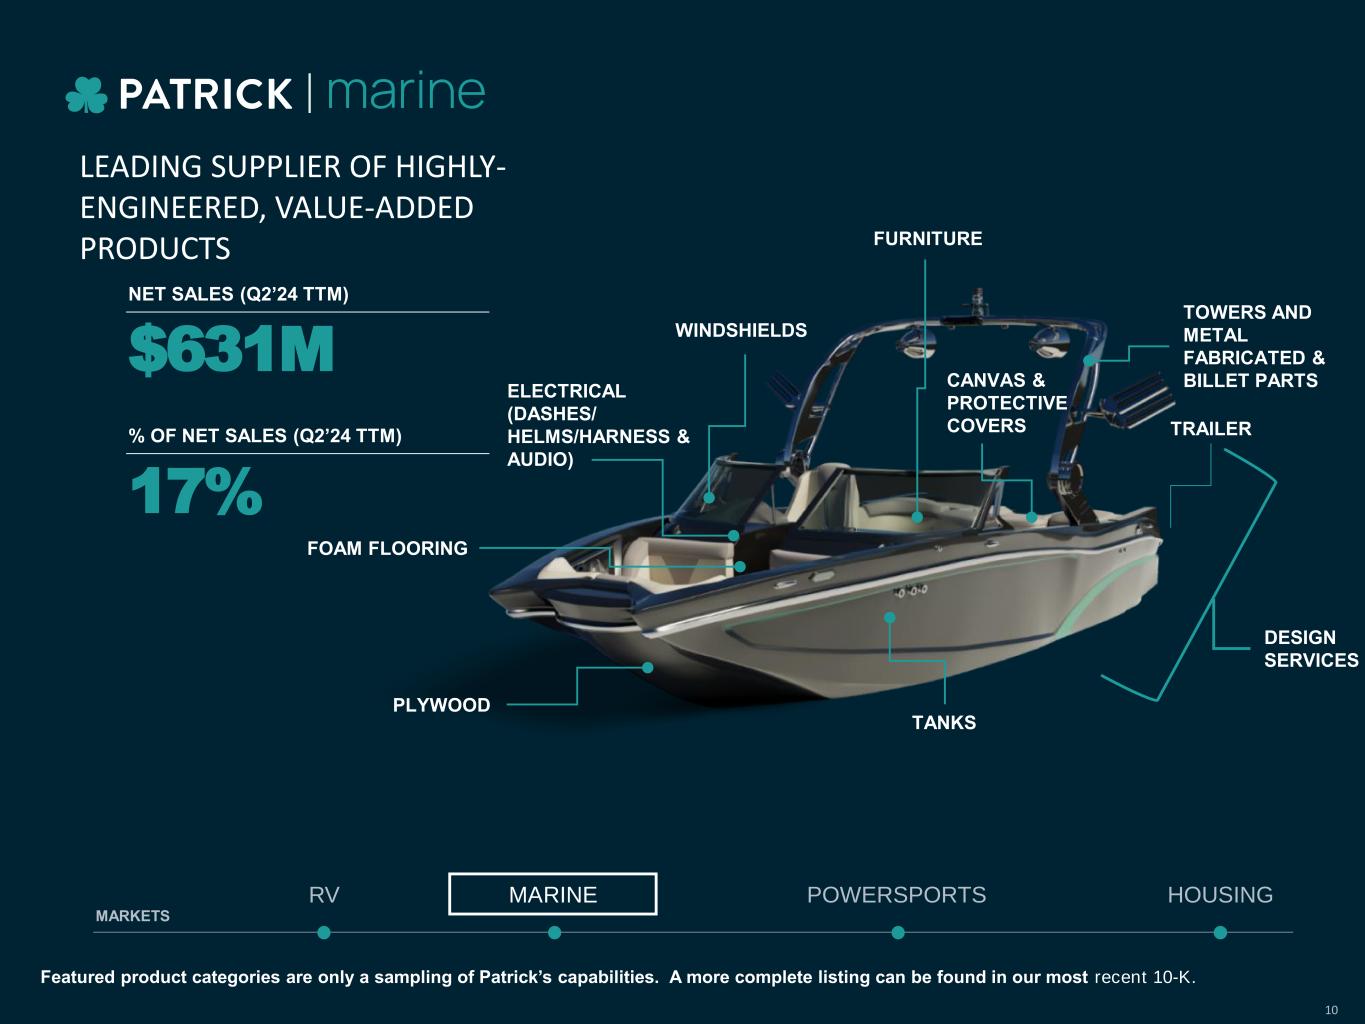
MARINE POWERSPORTS HOUSINGRV MARKETS LEADING SUPPLIER OF HIGHLY- ENGINEERED, VALUE-ADDED PRODUCTS $631M NET SALES (Q2’24 TTM) % OF NET SALES (Q2’24 TTM) 17% TOWERS AND METAL FABRICATED & BILLET PARTS DESIGN SERVICES FOAM FLOORING ELECTRICAL (DASHES/ HELMS/HARNESS & AUDIO) PLYWOOD CANVAS & PROTECTIVE COVERS FURNITURE TANKS Featured product categories are only a sampling of Patrick’s capabilities. A more complete listing can be found in our most recent 10-K. WINDSHIELDS TRAILER 10

POWERSPORTSMARINE HOUSINGRV MARKETS $274 $329 $339 $665 $914 $783 $631 2018 2019 2020 2021 2022 2023 Q2'24 TTM MARINE NET SALES ($ in millions) END MARKET NET SALES DRIVERS Wholesale powerboat unit shipments were down 27% in Q2’24 leading to a 30% decline in net sales y/y; during the same period ski/wake and pontoon shipments, were down ~ 57% and ~33%, respectively 1 CPU declined partially due to commodity costs passed back to customers and unfavorable mix of shipments in the period MARKET TRENDS • Customers remain cautious due to interest rate headwinds • Higher floorplan costs and lower retail velocity continue to drive dealers’ desire to destock inventory +16% CAGR 2018-Q2’24 TTM $1,169 $1,730 $2,069 $3,356 $4,430 $4,069 $3,935 2018 2019 2020 2021 2022 2023 Q2'24 TTM MARINE CONTENT PER UNIT 1 +25% CAGR 2018-Q2’24 TTM Disciplined OEM Production in Higher Interest Rate Environment 1 Company estimates based on data published by NMMA as of the Company’s reported Q2’2024 earnings on 08/01/2024 11
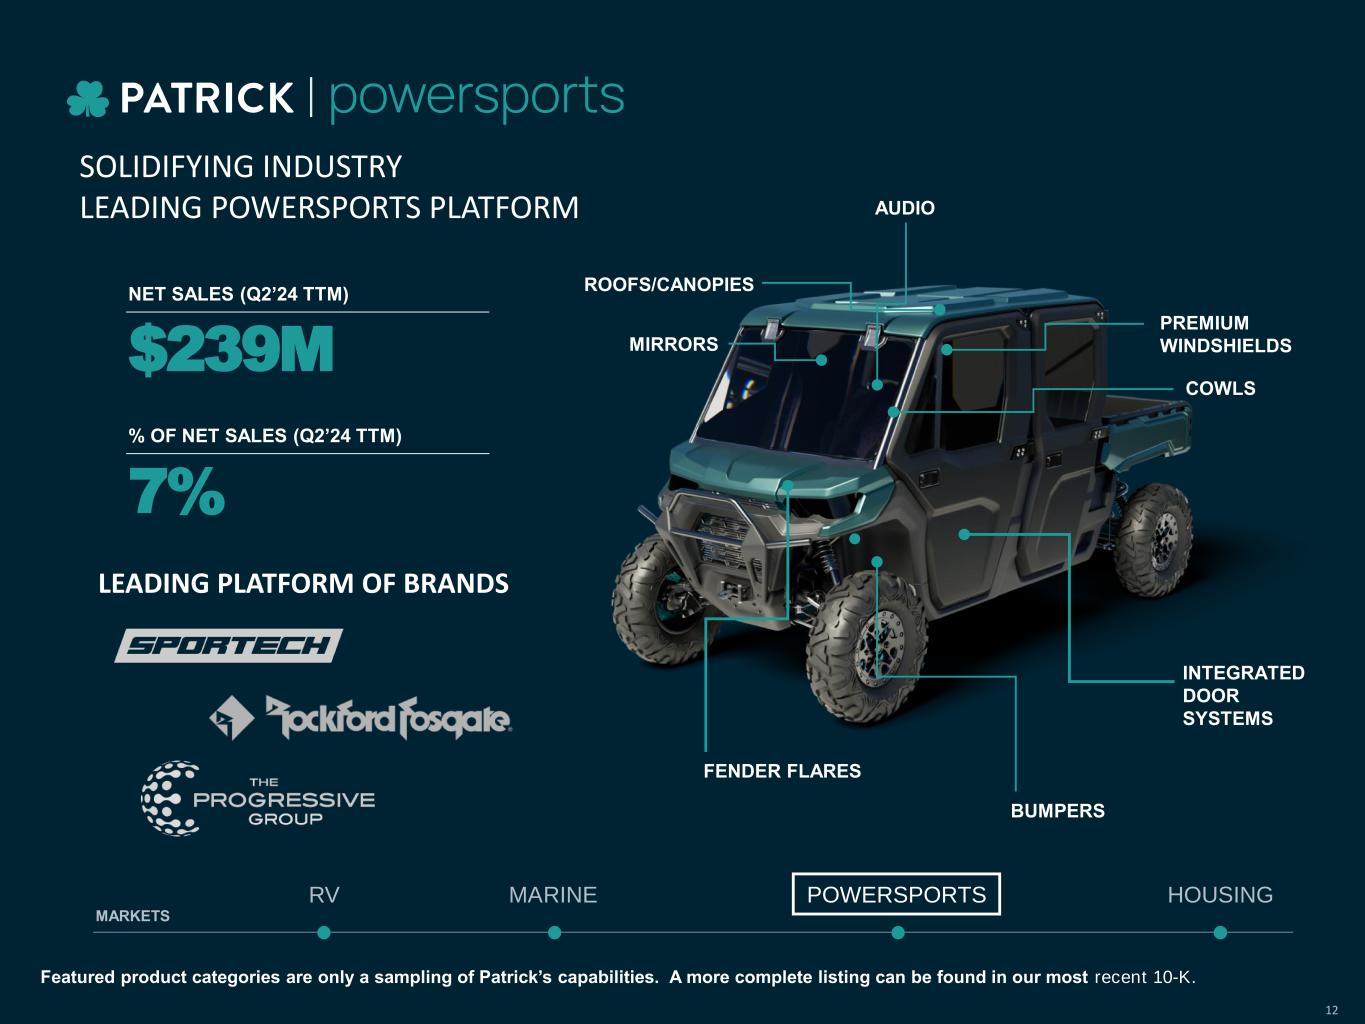
$239M NET SALES (Q2’24 TTM) % OF NET SALES (Q2’24 TTM) 7% ROOFS/CANOPIES MIRRORS PREMIUM WINDSHIELDS COWLS INTEGRATED DOOR SYSTEMS AUDIO FENDER FLARES SOLIDIFYING INDUSTRY LEADING POWERSPORTS PLATFORM MARINE POWERSPORTS HOUSINGRV MARKETS LEADING PLATFORM OF BRANDS BUMPERS Featured product categories are only a sampling of Patrick’s capabilities. A more complete listing can be found in our most recent 10-K. 12
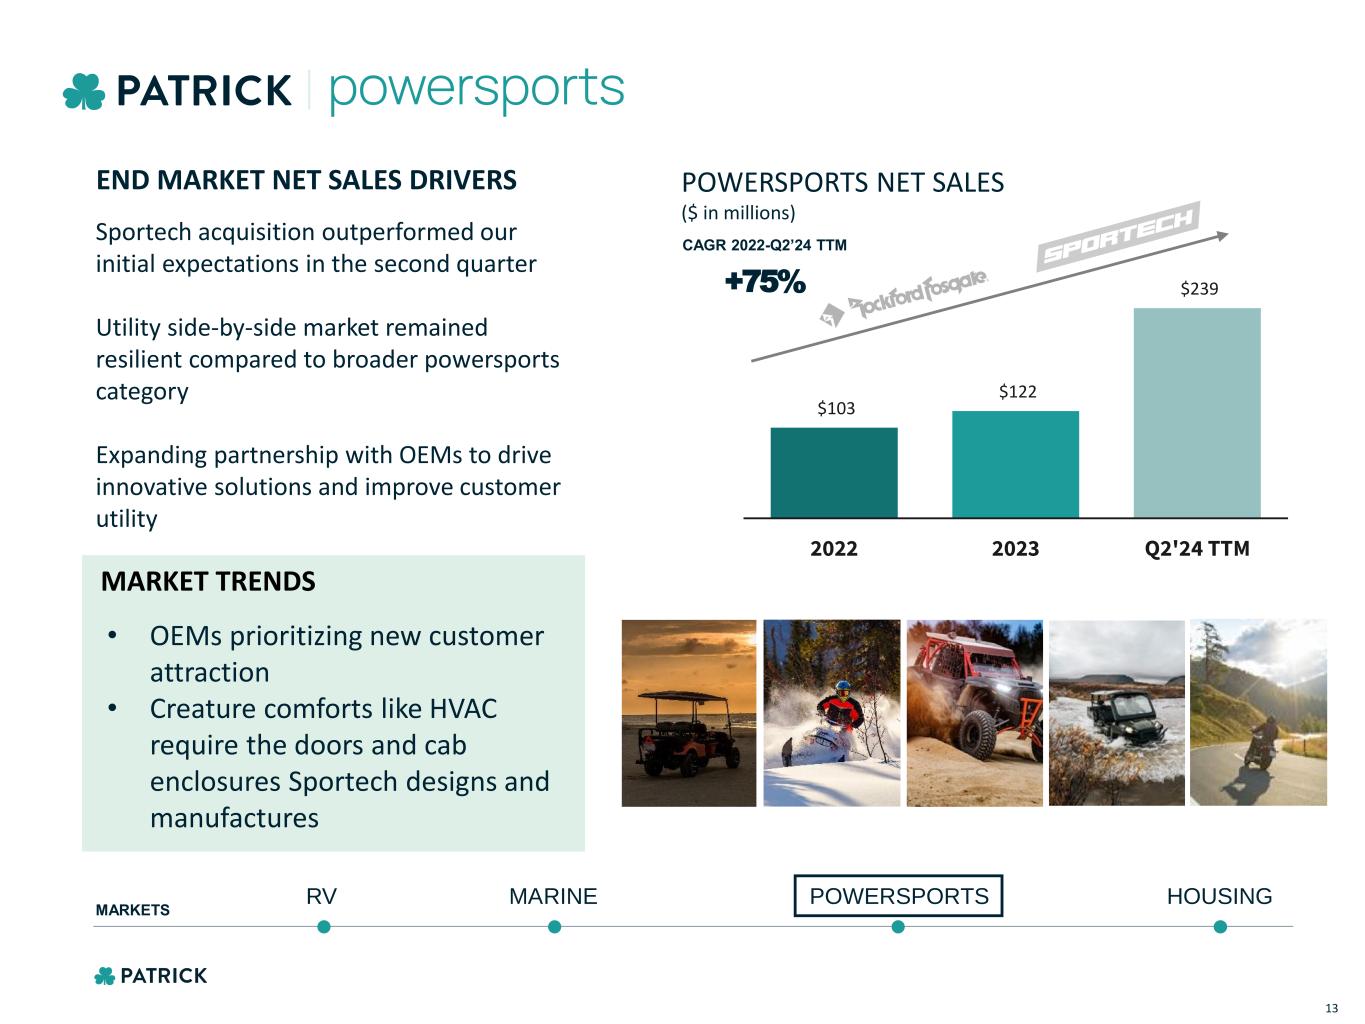
$103 $122 $239 2022 2023 Q2'24 TTM POWERSPORTSMARINE HOUSINGRV MARKETS POWERSPORTS NET SALES ($ in millions) END MARKET NET SALES DRIVERS Sportech acquisition outperformed our initial expectations in the second quarter Utility side-by-side market remained resilient compared to broader powersports category Expanding partnership with OEMs to drive innovative solutions and improve customer utility MARKET TRENDS • OEMs prioritizing new customer attraction • Creature comforts like HVAC require the doors and cab enclosures Sportech designs and manufactures +75% CAGR 2022-Q2’24 TTM 13
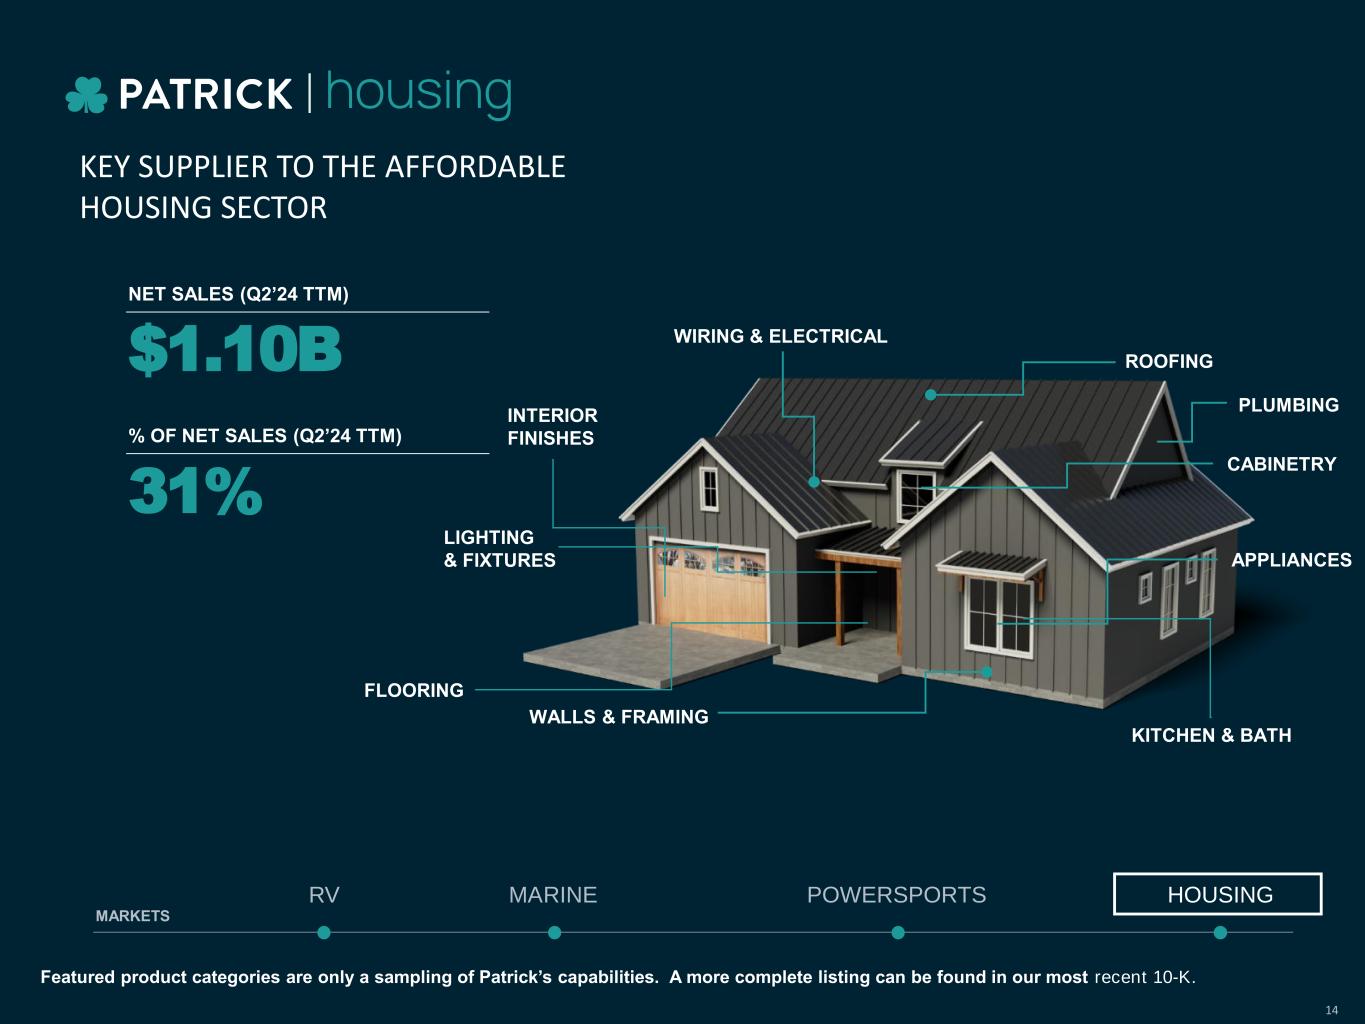
Featured product categories are only a sampling of Patrick’s capabilities. A more complete listing can be found in our most recent 10-K. KEY SUPPLIER TO THE AFFORDABLE HOUSING SECTOR MARINE POWERSPORTS HOUSINGRV MARKETS $1.10B NET SALES (Q2’24 TTM) % OF NET SALES (Q2’24 TTM) 31% LIGHTING & FIXTURES CABINETRY APPLIANCES ROOFING WALLS & FRAMING FLOORING WIRING & ELECTRICAL PLUMBING INTERIOR FINISHES KITCHEN & BATH 14
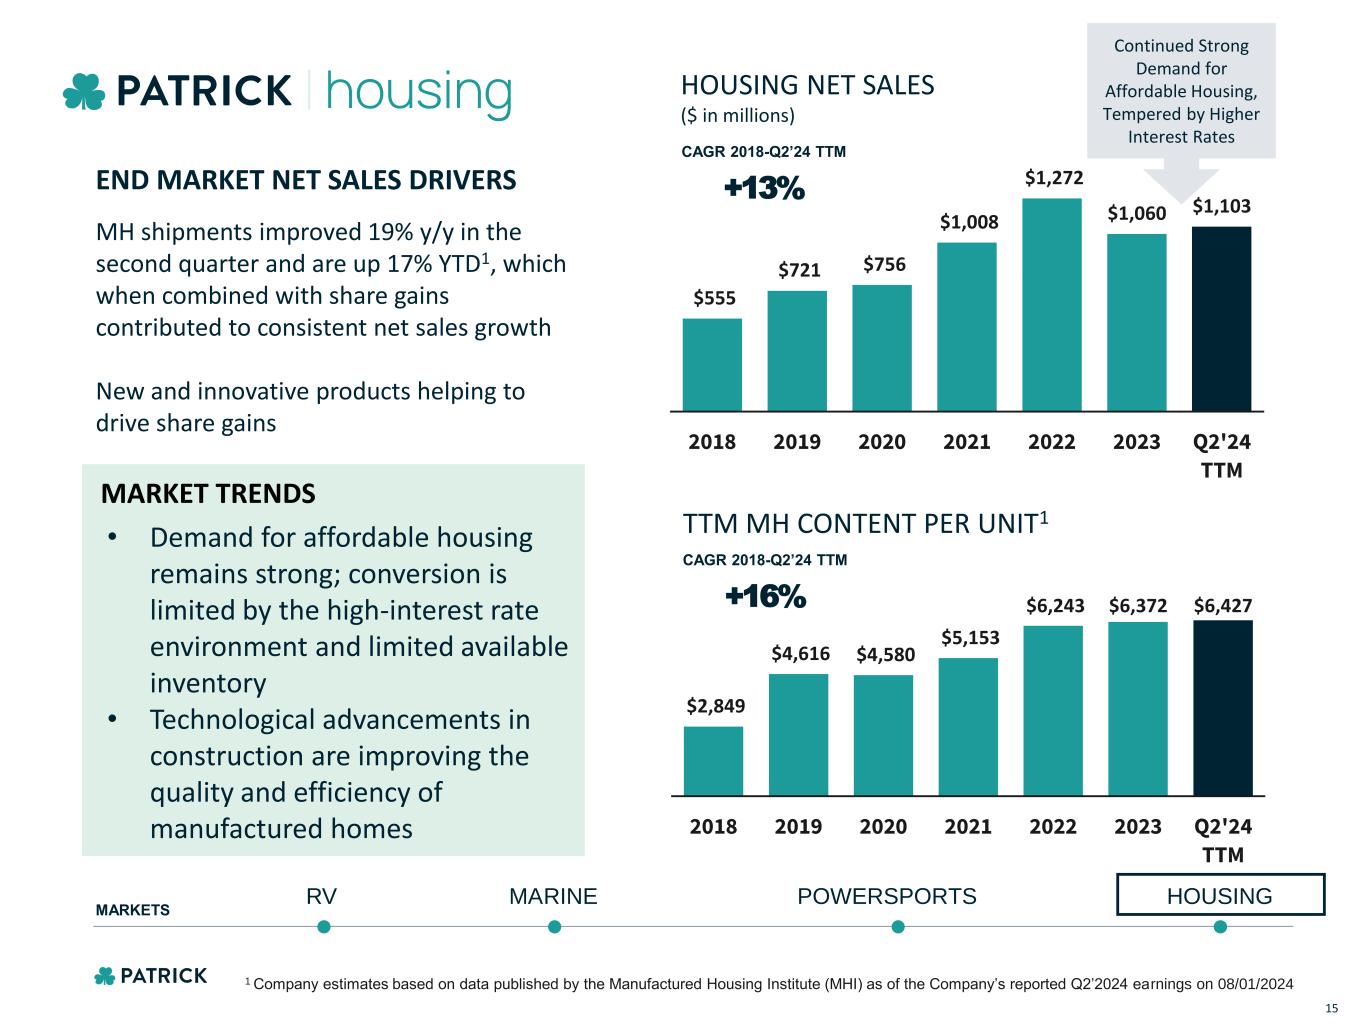
$2,849 $4,616 $4,580 $5,153 $6,243 $6,372 $6,427 2018 2019 2020 2021 2022 2023 Q2'24 TTM POWERSPORTSMARINE HOUSINGRV MARKETS $555 $721 $756 $1,008 $1,272 $1,060 $1,103 2018 2019 2020 2021 2022 2023 Q2'24 TTM HOUSING NET SALES ($ in millions) END MARKET NET SALES DRIVERS MH shipments improved 19% y/y in the second quarter and are up 17% YTD1, which when combined with share gains contributed to consistent net sales growth New and innovative products helping to drive share gains MARKET TRENDS • Demand for affordable housing remains strong; conversion is limited by the high-interest rate environment and limited available inventory • Technological advancements in construction are improving the quality and efficiency of manufactured homes +13% CAGR 2018-Q2’24 TTM TTM MH CONTENT PER UNIT1 +16% CAGR 2018-Q2’24 TTM Continued Strong Demand for Affordable Housing, Tempered by Higher Interest Rates 1 Company estimates based on data published by the Manufactured Housing Institute (MHI) as of the Company’s reported Q2’2024 earnings on 08/01/2024 15

Trusted Partner and Supplier of Choice Strategic Priorities 16 Support our brands’ organic growth while remaining poised and ready to execute on strategic opportunities across the Outdoor Enthusiast and Housing markets CONTINUE STRATEGIC DIVERSIFICATION Maintain strong balance sheet and robust cash flow generation bolstering ability to navigate economic challenges and pursue profitable growth opportunities MAINTAIN SOLID FINANCIAL FOUNDATION Leverage cross-selling synergies, utilize innovation playbook, and optimize core competencies ADVANCE ORGANIC GROWTH

Credit Highlights
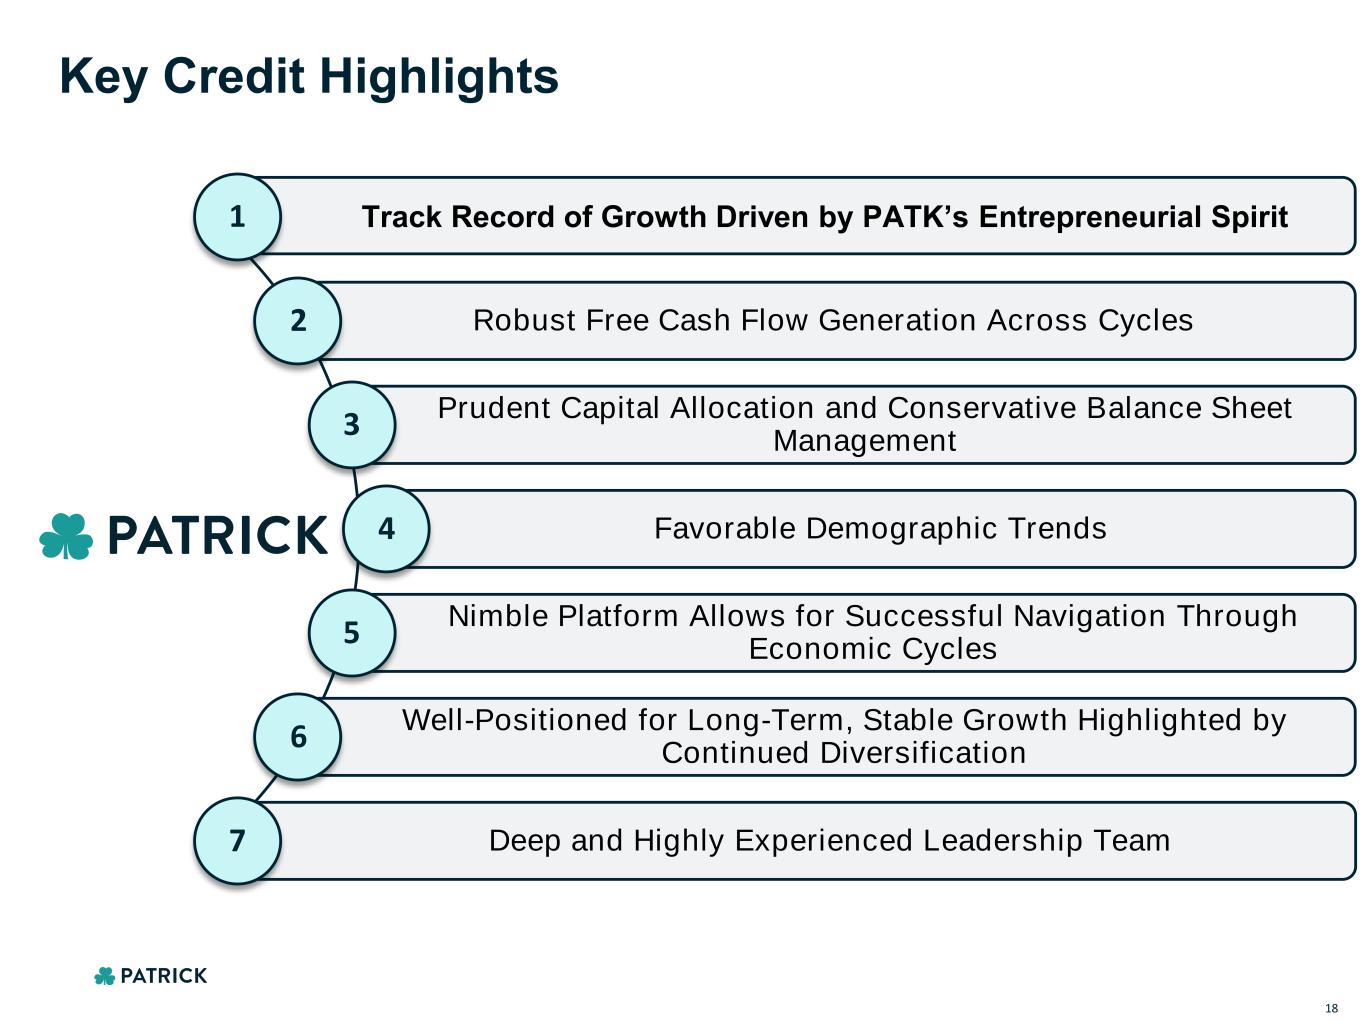
Key Credit Highlights Track Record of Growth Driven by PATK’s Entrepreneurial Spirit Well-Positioned for Long-Term, Stable Growth Highlighted by Continued Diversification Nimble Platform Allows for Successful Navigation Through Economic Cycles Deep and Highly Experienced Leadership Team Robust Free Cash Flow Generation Across Cycles Prudent Capital Allocation and Conservative Balance Sheet Management Favorable Demographic Trends 1 2 3 4 5 6 7 18
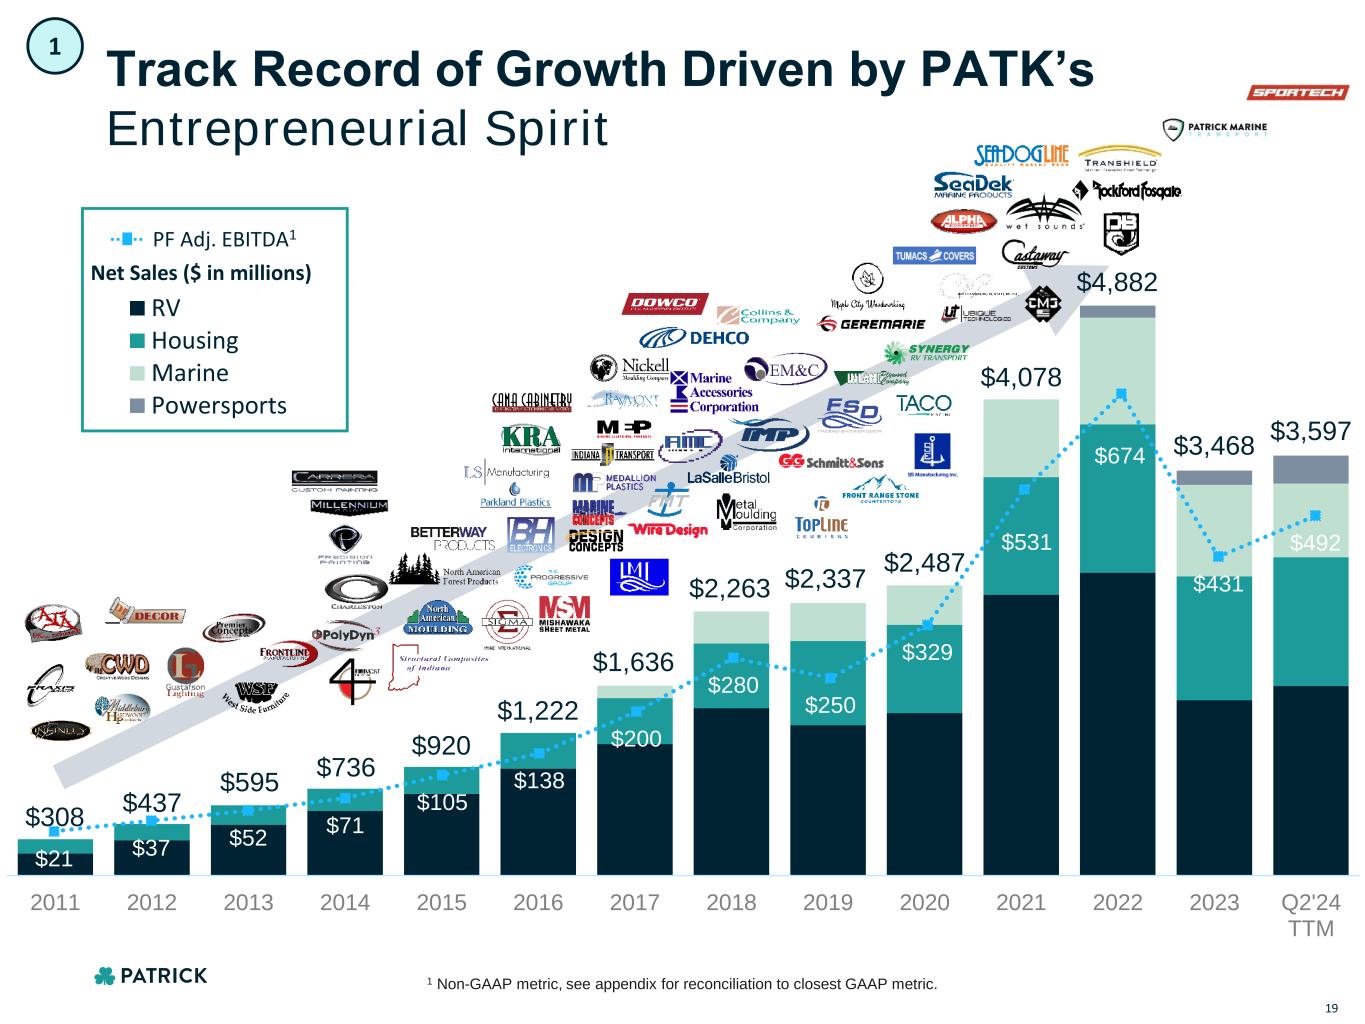
$0 $1,000,000 $2,000,000 $3,000,000 $4,000,000 $5,000,000 $6,000,000 2011 2012 2013 2014 2015 2016 2017 2018 2019 2020 2021 2022 2023 Q2'24 TTM RV Housing Marine Powersports $21 $37 $52 $71 $105 $138 $200 $280 $250 $329 $531 $674 $431 $492 Track Record of Growth Driven by PATK’s Entrepreneurial Spirit $308 $437 $595 $736 $920 $1,222 $1,636 $2,263 $2,337 $2,487 $4,078 $4,882 $3,468 $3,597 PF Adj. EBITDA1 Net Sales ($ in millions) 19 1 1 Non-GAAP metric, see appendix for reconciliation to closest GAAP metric.
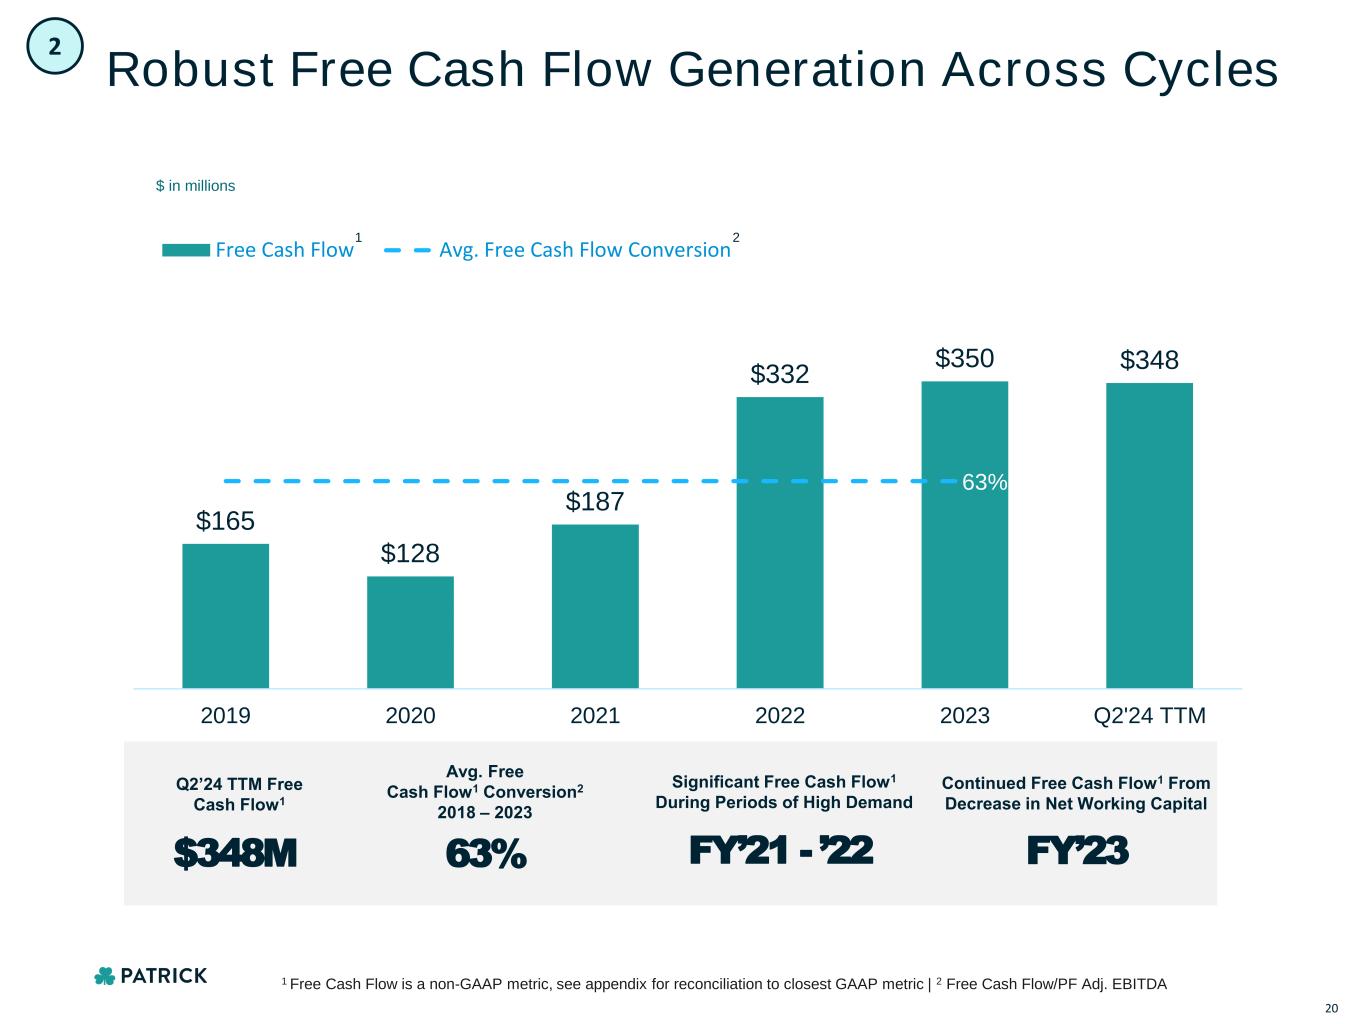
$165 $128 $187 $332 $350 $348 63% $0 $0 $0 $1 $1 $1 $1 $0 $50 $100 $150 $200 $250 $300 $350 $400 $450 2019 2020 2021 2022 2023 Q2'24 TTM Free Cash Flow Avg. Free Cash Flow Conversion $ in millions Robust Free Cash Flow Generation Across Cycles 2 FY’21 - ’22 Significant Free Cash Flow1 During Periods of High Demand 63% Avg. Free Cash Flow1 Conversion2 2018 – 2023 $348M Q2’24 TTM Free Cash Flow1 FY’23 Continued Free Cash Flow1 From Decrease in Net Working Capital 1 20 1 Free Cash Flow is a non-GAAP metric, see appendix for reconciliation to closest GAAP metric | 2 Free Cash Flow/PF Adj. EBITDA 2
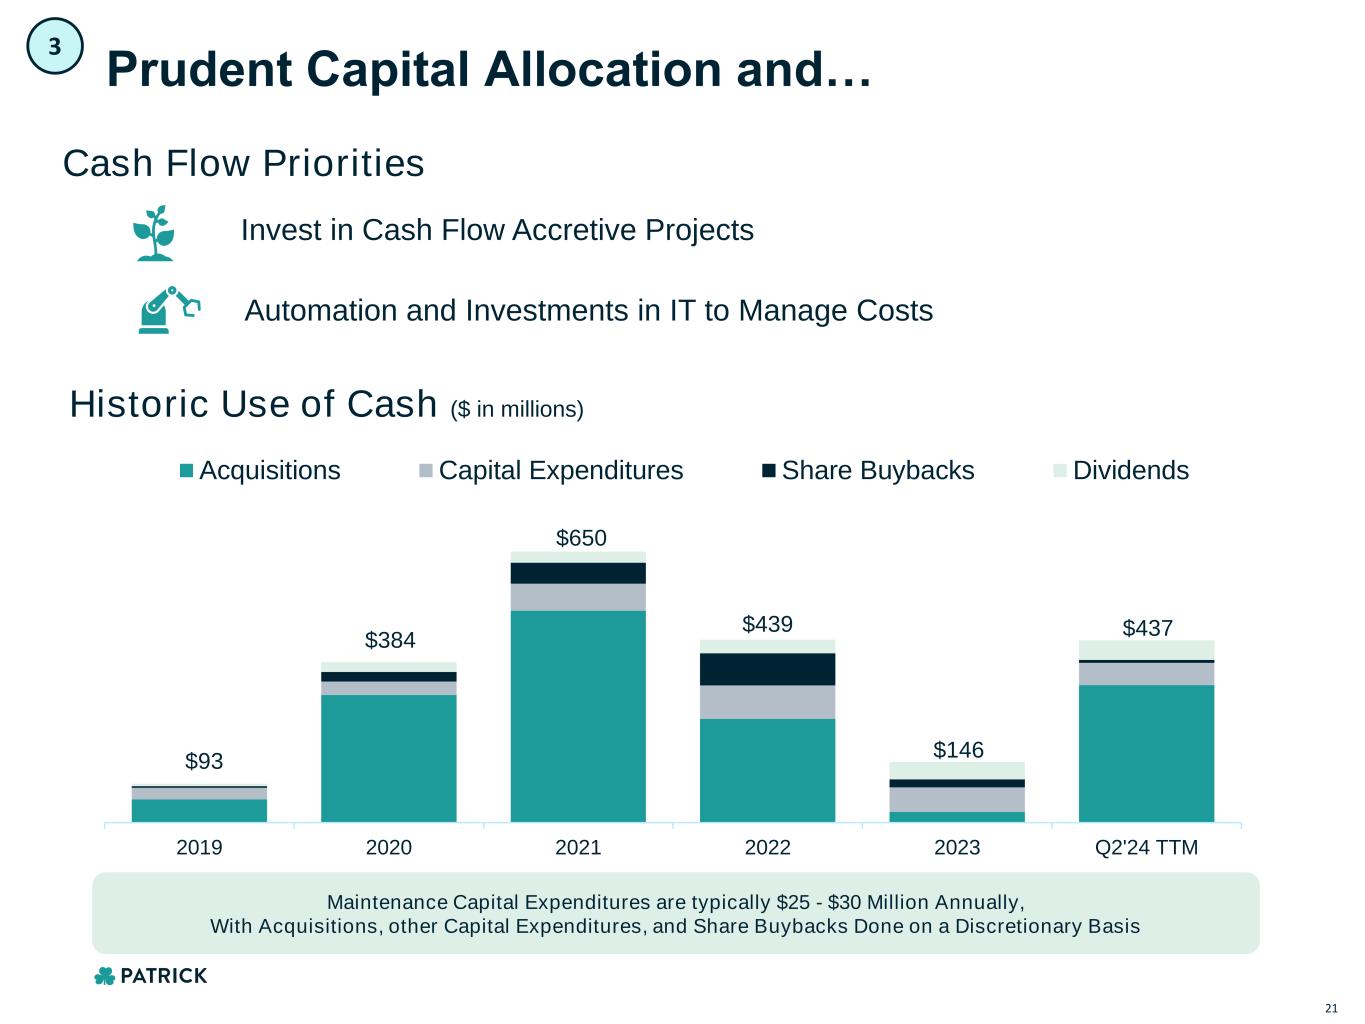
Prudent Capital Allocation and… $93 $384 $650 $439 $146 $437 2019 2020 2021 2022 2023 Q2'24 TTM Acquisitions Capital Expenditures Share Buybacks Dividends Cash Flow Priorities Invest in Cash Flow Accretive Projects Automation and Investments in IT to Manage Costs Historic Use of Cash ($ in millions) 3 21 Maintenance Capital Expenditures are typically $25 - $30 Million Annually, With Acquisitions, other Capital Expenditures, and Share Buybacks Done on a Discretionary Basis
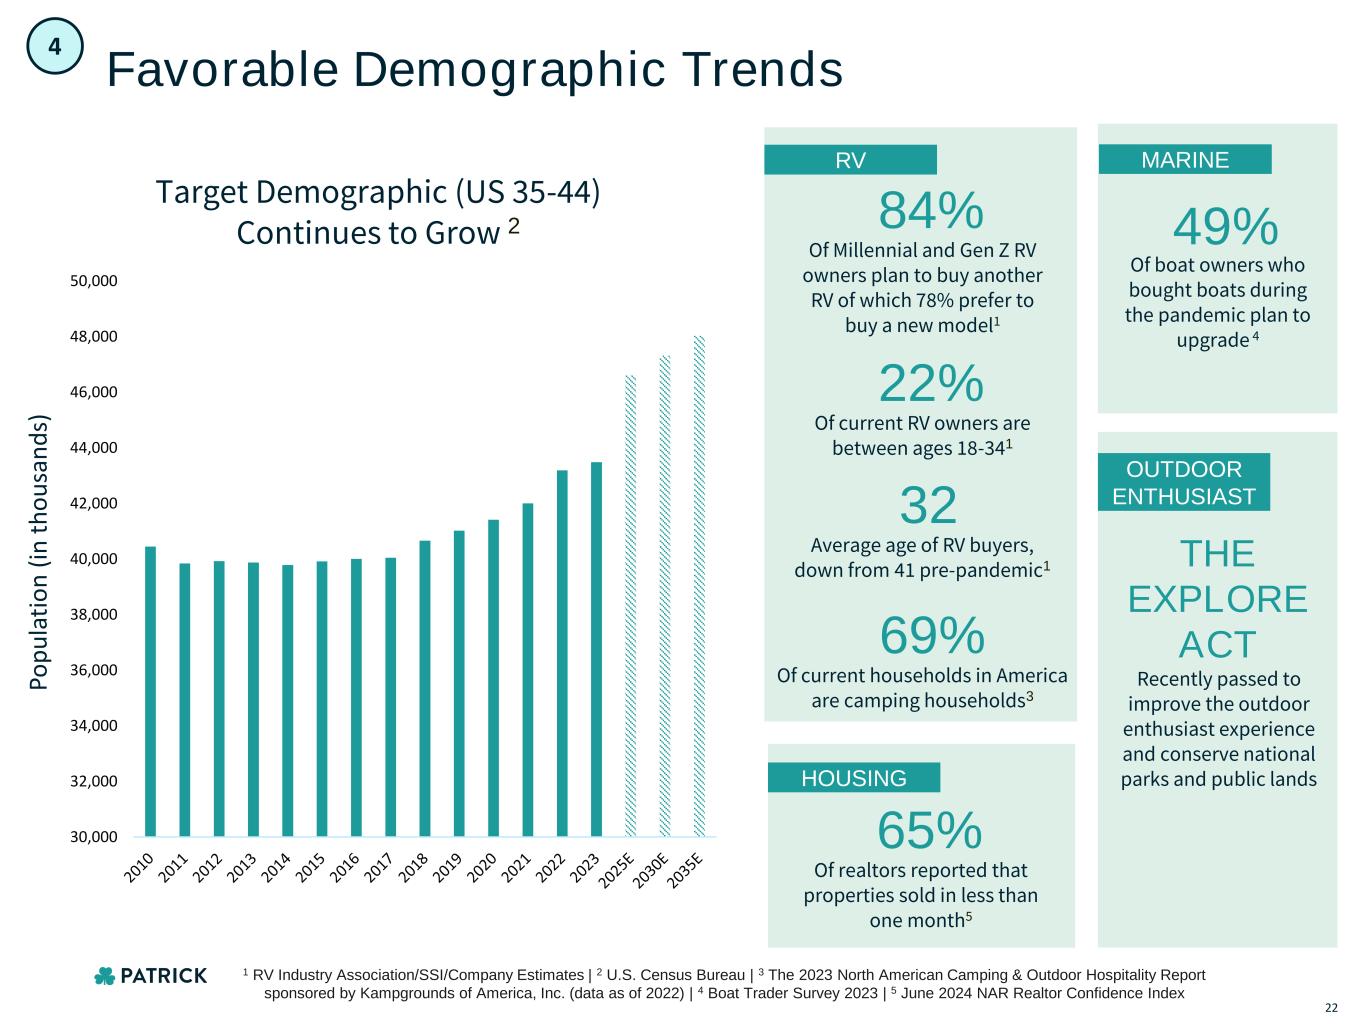
Favorable Demographic Trends Target Demographic (US 35-44) Continues to Grow 2 HOUSING RV MARINE OUTDOOR ENTHUSIAST Of current RV owners are between ages 18-341 22% Of Millennial and Gen Z RV owners plan to buy another RV of which 78% prefer to buy a new model1 84% Of realtors reported that properties sold in less than one month5 65% Of current households in America are camping households3 69% Of boat owners who bought boats during the pandemic plan to upgrade 4 49% Recently passed to improve the outdoor enthusiast experience and conserve national parks and public lands THE EXPLORE ACT Po p u la ti o n ( in t h o u sa n d s) 30,000 32,000 34,000 36,000 38,000 40,000 42,000 44,000 46,000 48,000 50,000 4 22 1 RV Industry Association/SSI/Company Estimates | 2 U.S. Census Bureau | 3 The 2023 North American Camping & Outdoor Hospitality Report sponsored by Kampgrounds of America, Inc. (data as of 2022) | 4 Boat Trader Survey 2023 | 5 June 2024 NAR Realtor Confidence Index Average age of RV buyers, down from 41 pre-pandemic1 32
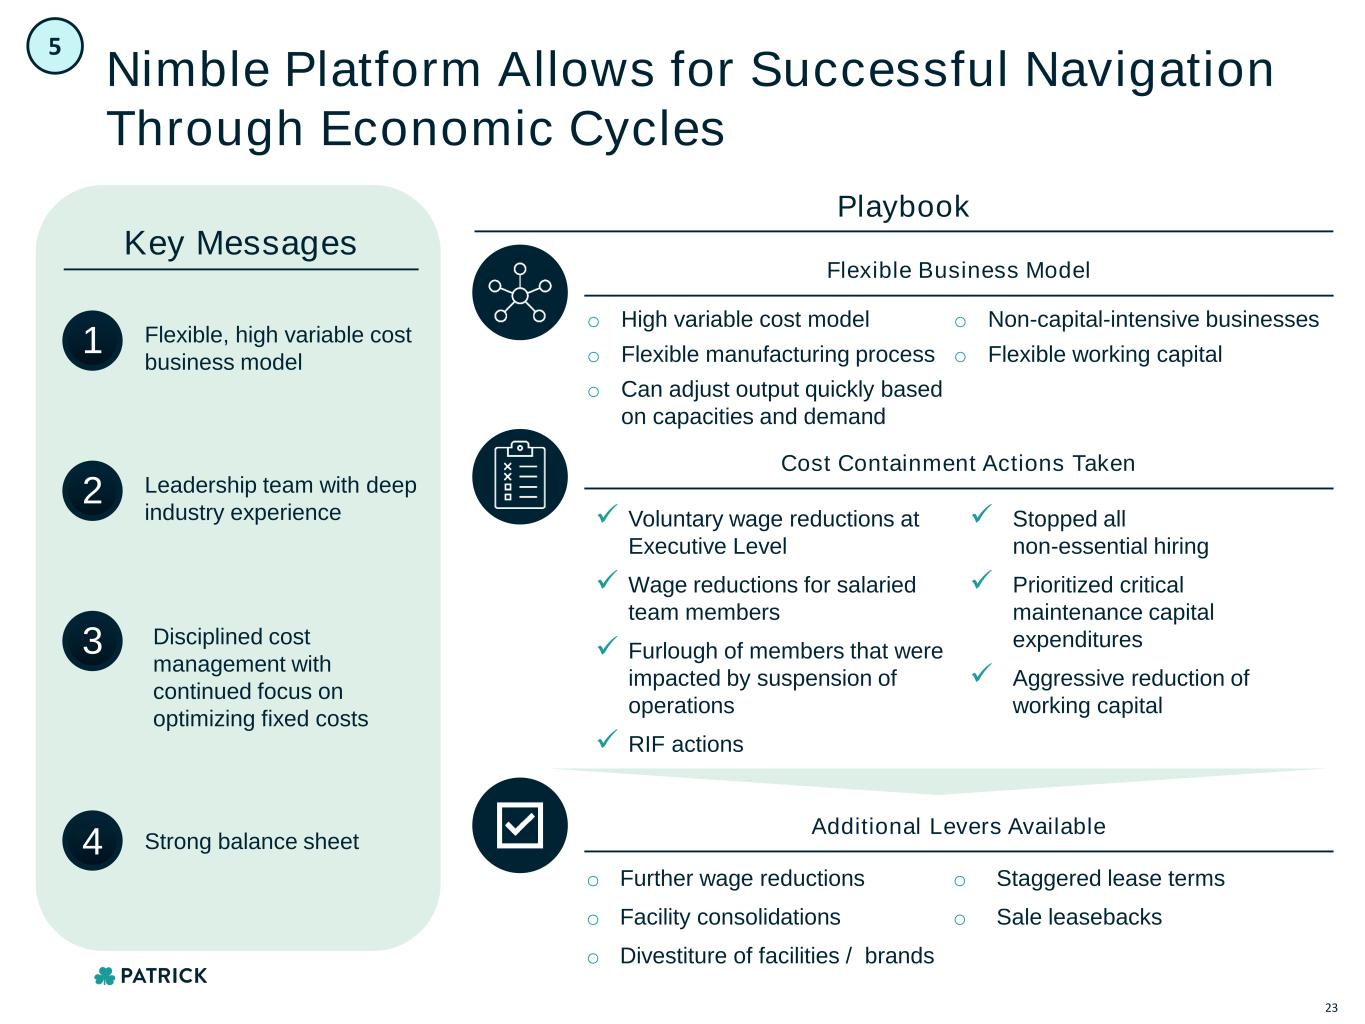
o High variable cost model o Flexible manufacturing process o Can adjust output quickly based on capacities and demand o Non-capital-intensive businesses o Flexible working capital Nimble Platform Allows for Successful Navigation Through Economic Cycles Flexible, high variable cost business model 1 Leadership team with deep industry experience 2 Disciplined cost management with continued focus on optimizing fixed costs 3 Strong balance sheet4 Key Messages ✓ Voluntary wage reductions at Executive Level ✓ Wage reductions for salaried team members ✓ Furlough of members that were impacted by suspension of operations ✓ RIF actions ✓ Stopped all non-essential hiring ✓ Prioritized critical maintenance capital expenditures ✓ Aggressive reduction of working capital o Further wage reductions o Facility consolidations o Divestiture of facilities / brands o Staggered lease terms o Sale leasebacks Playbook Flexible Business Model Cost Containment Actions Taken Additional Levers Available 5 23
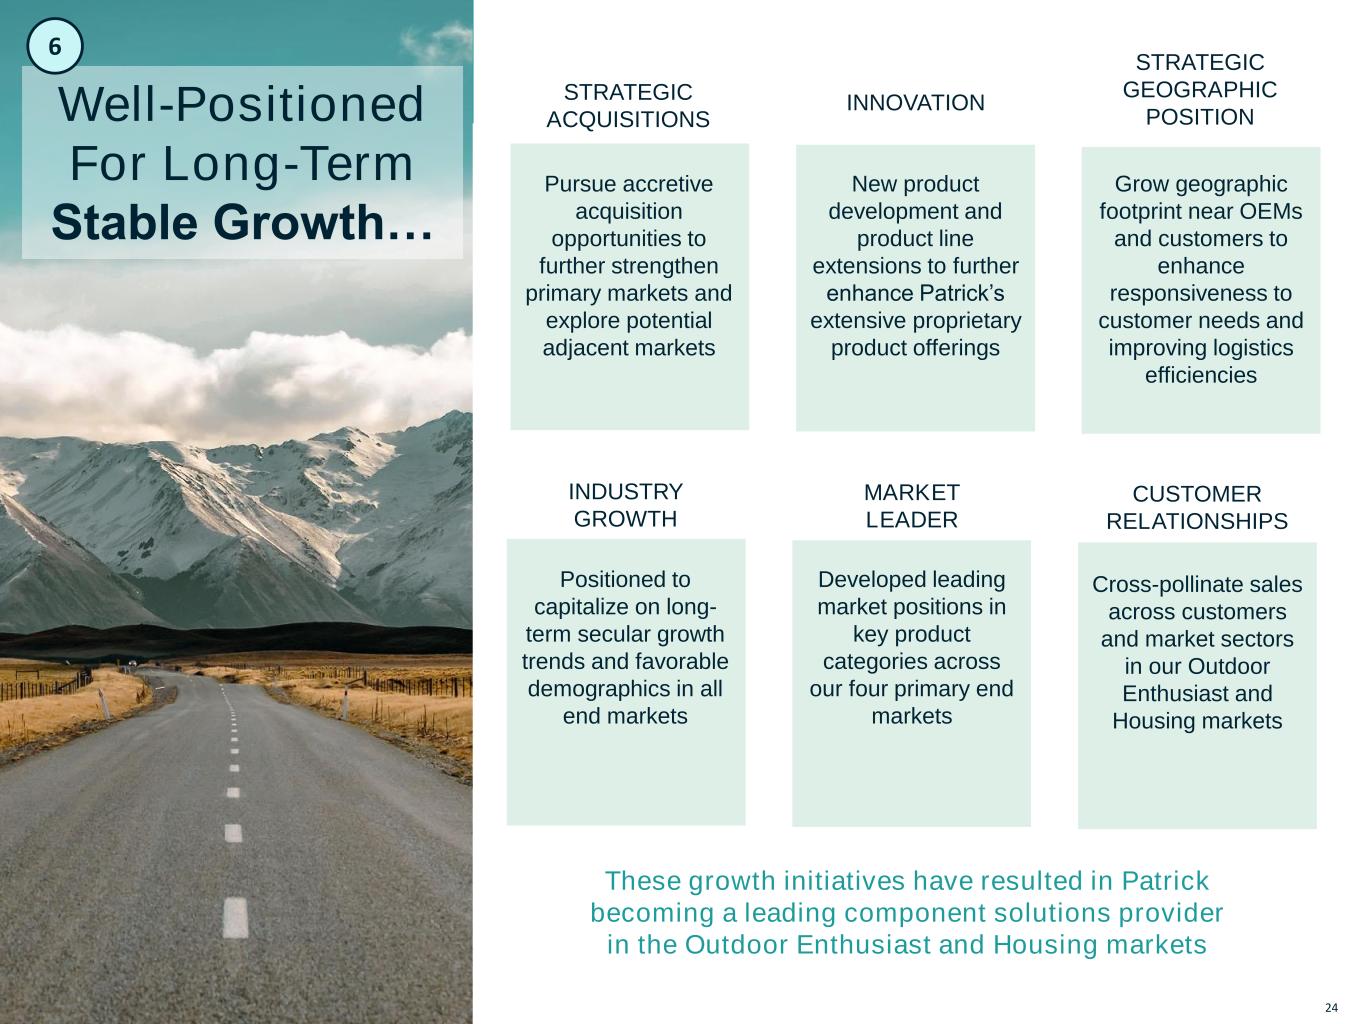
Well-Positioned For Long-Term Stable Growth… These growth initiatives have resulted in Patrick becoming a leading component solutions provider in the Outdoor Enthusiast and Housing markets STRATEGIC ACQUISITIONS INNOVATION STRATEGIC GEOGRAPHIC POSITION Pursue accretive acquisition opportunities to further strengthen primary markets and explore potential adjacent markets New product development and product line extensions to further enhance Patrick’s extensive proprietary product offerings Grow geographic footprint near OEMs and customers to enhance responsiveness to customer needs and improving logistics efficiencies INDUSTRY GROWTH MARKET LEADER CUSTOMER RELATIONSHIPS Positioned to capitalize on long- term secular growth trends and favorable demographics in all end markets Developed leading market positions in key product categories across our four primary end markets Cross-pollinate sales across customers and market sectors in our Outdoor Enthusiast and Housing markets 6 24
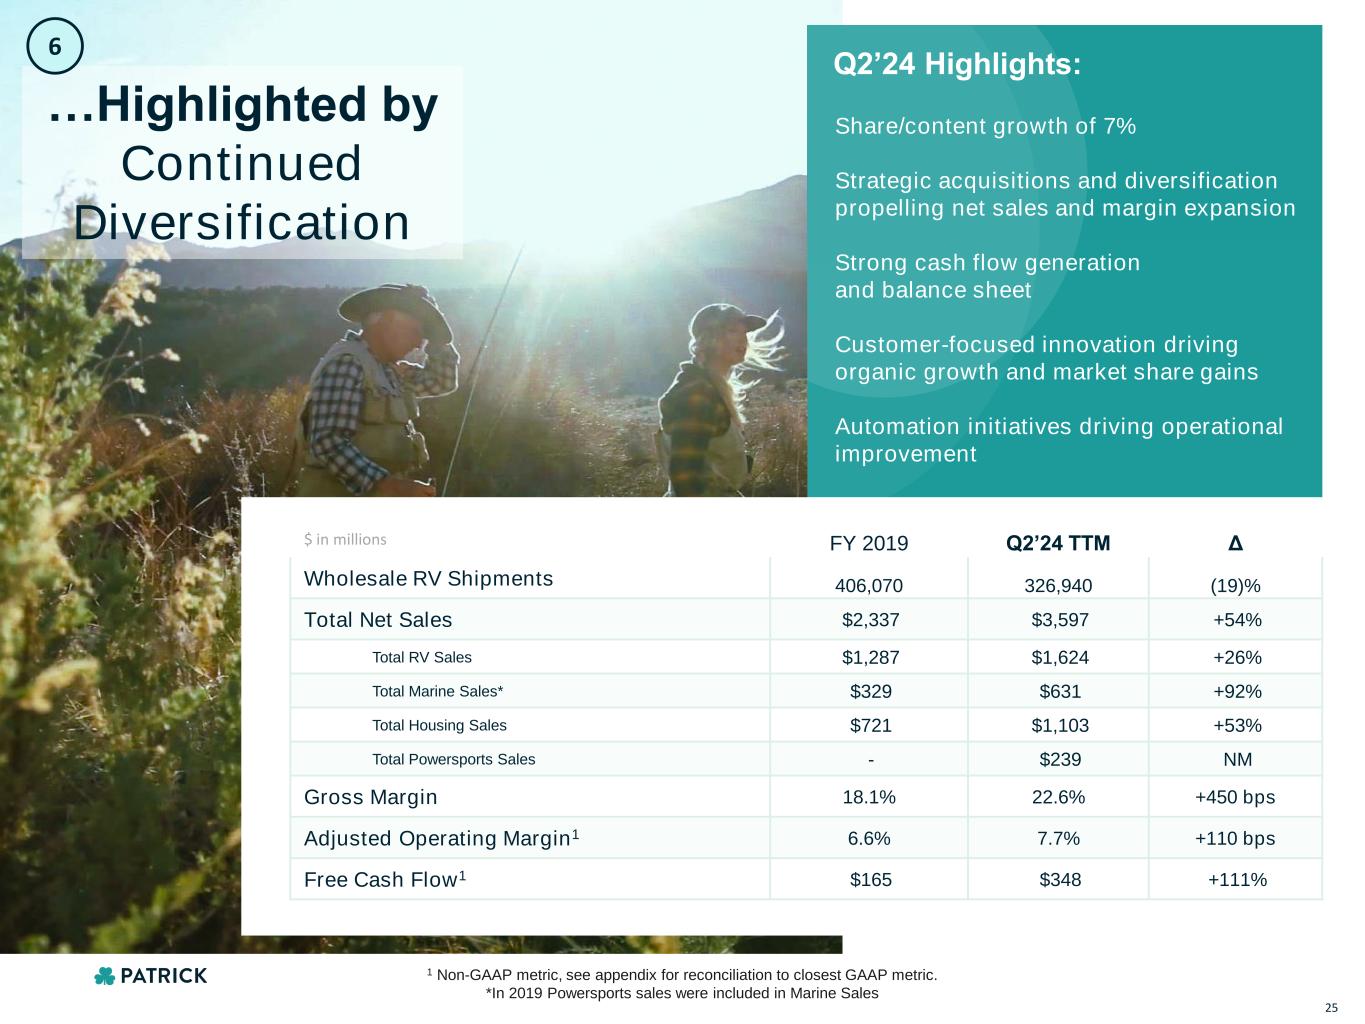
$ in millions FY 2019 Q2’24 TTM Δ Wholesale RV Shipments 406,070 326,940 (19)% Total Net Sales $2,337 $3,597 +54% Total RV Sales $1,287 $1,624 +26% Total Marine Sales* $329 $631 +92% Total Housing Sales $721 $1,103 +53% Total Powersports Sales - $239 NM Gross Margin 18.1% 22.6% +450 bps Adjusted Operating Margin1 6.6% 7.7% +110 bps Free Cash Flow1 $165 $348 +111% Share/content growth of 7% Strategic acquisitions and diversification propelling net sales and margin expansion Strong cash flow generation and balance sheet Customer-focused innovation driving organic growth and market share gains Automation initiatives driving operational improvement Q2’24 Highlights: …Highlighted by Continued Diversification 6 25 1 Non-GAAP metric, see appendix for reconciliation to closest GAAP metric. *In 2019 Powersports sales were included in Marine Sales
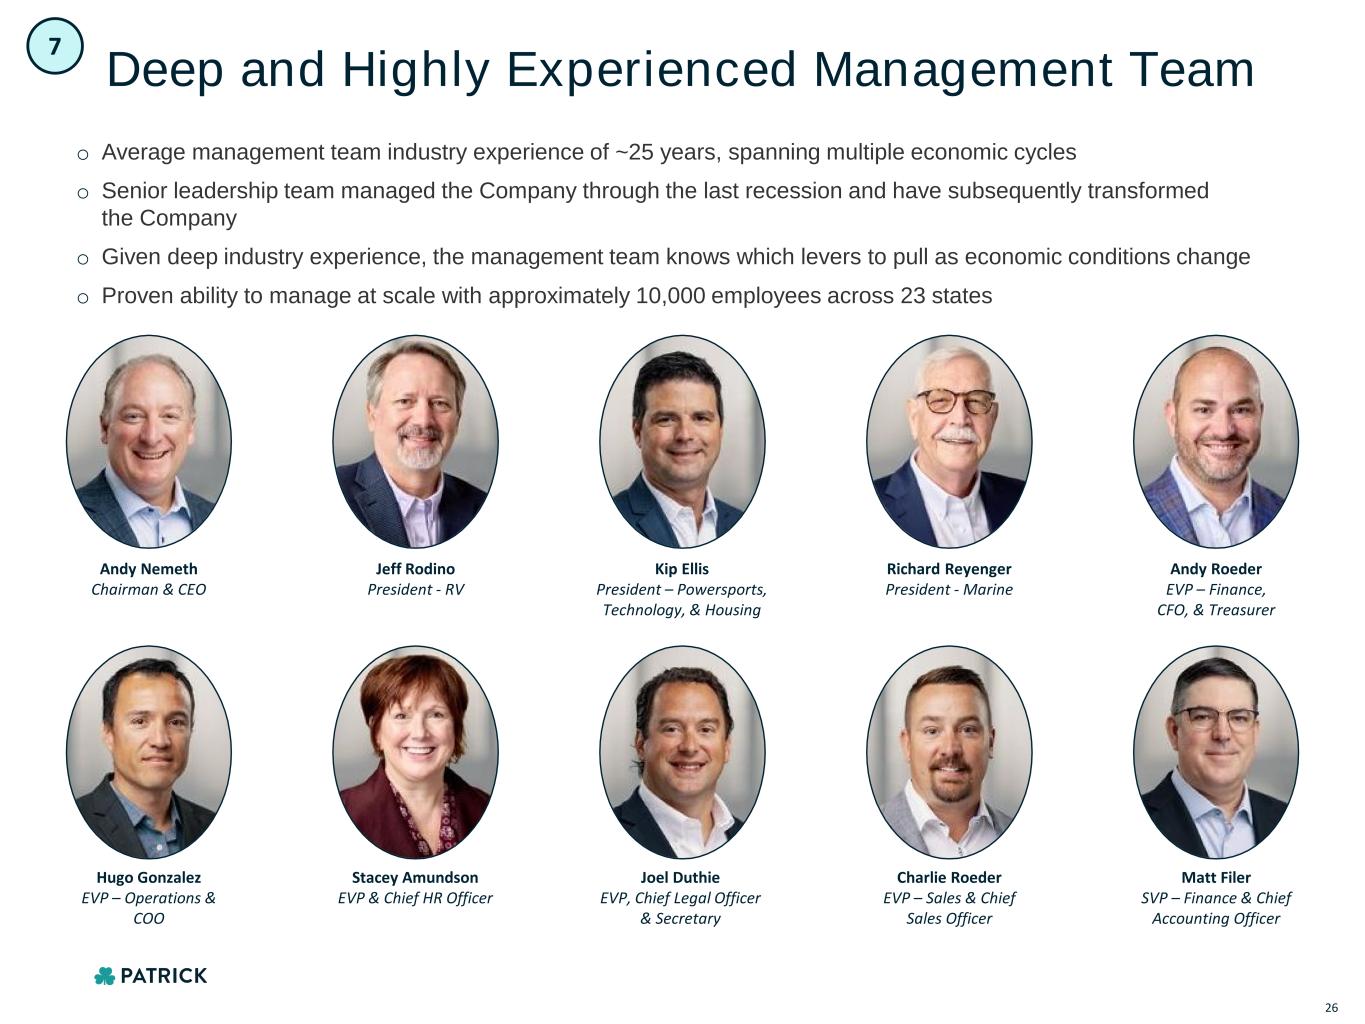
Deep and Highly Experienced Management Team o Average management team industry experience of ~25 years, spanning multiple economic cycles o Senior leadership team managed the Company through the last recession and have subsequently transformed the Company o Given deep industry experience, the management team knows which levers to pull as economic conditions change o Proven ability to manage at scale with approximately 10,000 employees across 23 states Andy Nemeth Chairman & CEO Jeff Rodino President - RV Kip Ellis President – Powersports, Technology, & Housing Richard Reyenger President - Marine Andy Roeder EVP – Finance, CFO, & Treasurer Hugo Gonzalez EVP – Operations & COO Stacey Amundson EVP & Chief HR Officer Joel Duthie EVP, Chief Legal Officer & Secretary Matt Filer SVP – Finance & Chief Accounting Officer Charlie Roeder EVP – Sales & Chief Sales Officer 7 26

Financial Overview
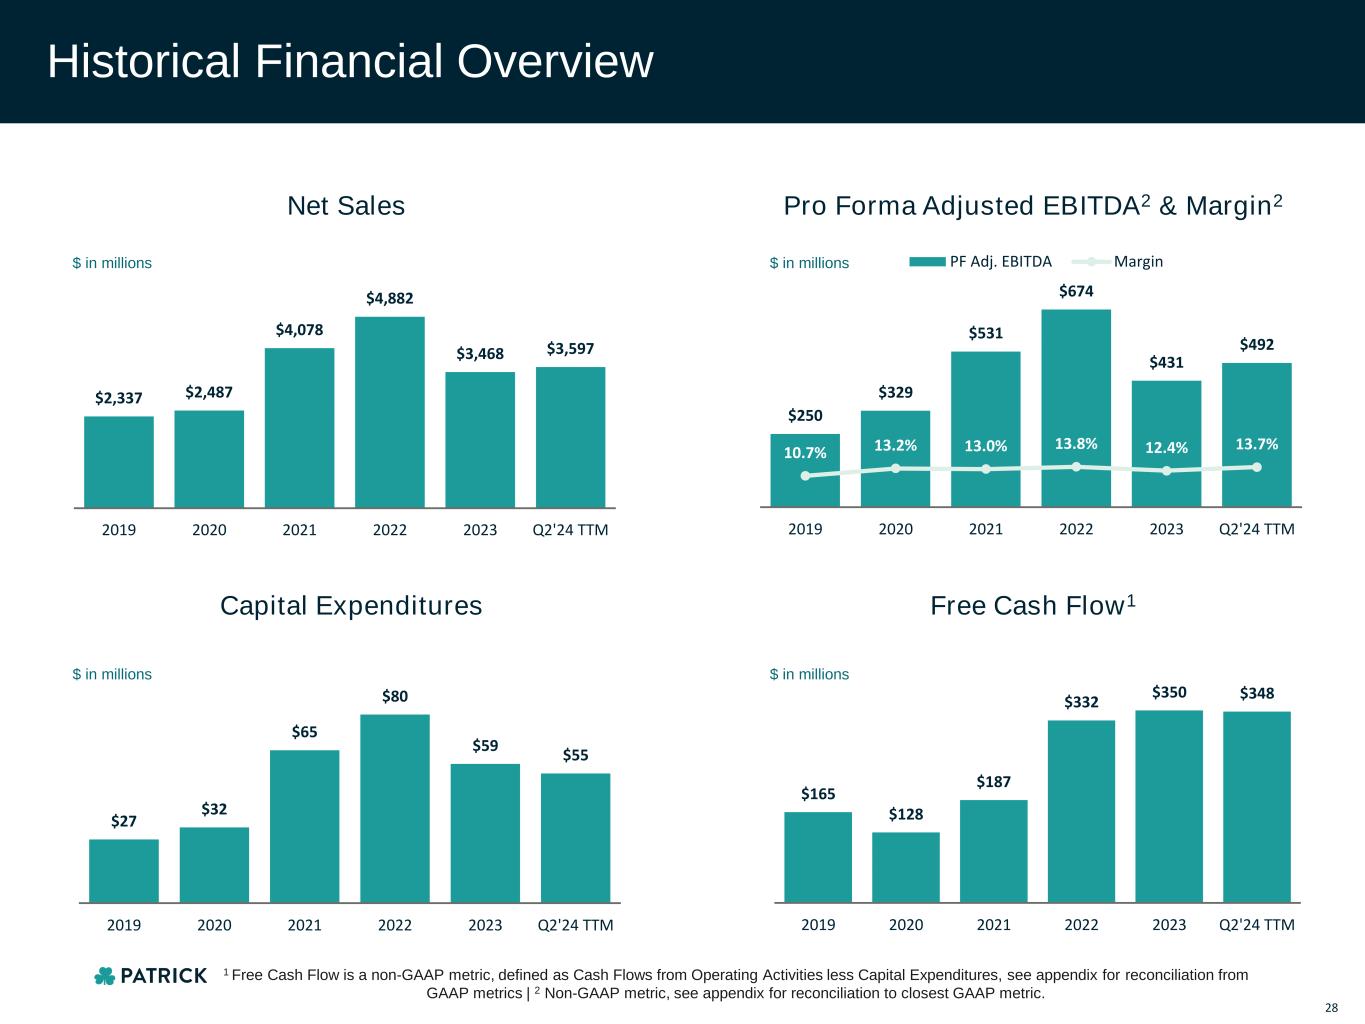
Historical Financial Overview $27 $32 $65 $80 $59 $55 2019 2020 2021 2022 2023 Q2'24 TTM $2,337 $2,487 $4,078 $4,882 $3,468 $3,597 2019 2020 2021 2022 2023 Q2'24 TTM $250 $329 $531 $674 $431 $492 10.7% 13.2% 13.0% 13.8% 12.4% 13.7% 2019 2020 2021 2022 2023 Q2'24 TTM PF Adj. EBITDA Margin Net Sales Pro Forma Adjusted EBITDA2 & Margin2 $165 $128 $187 $332 $350 $348 2019 2020 2021 2022 2023 Q2'24 TTM Capital Expenditures Free Cash Flow1 $ in millions $ in millions $ in millions $ in millions 28 1 Free Cash Flow is a non-GAAP metric, defined as Cash Flows from Operating Activities less Capital Expenditures, see appendix for reconciliation from GAAP metrics | 2 Non-GAAP metric, see appendix for reconciliation to closest GAAP metric.

Q&A

Appendix
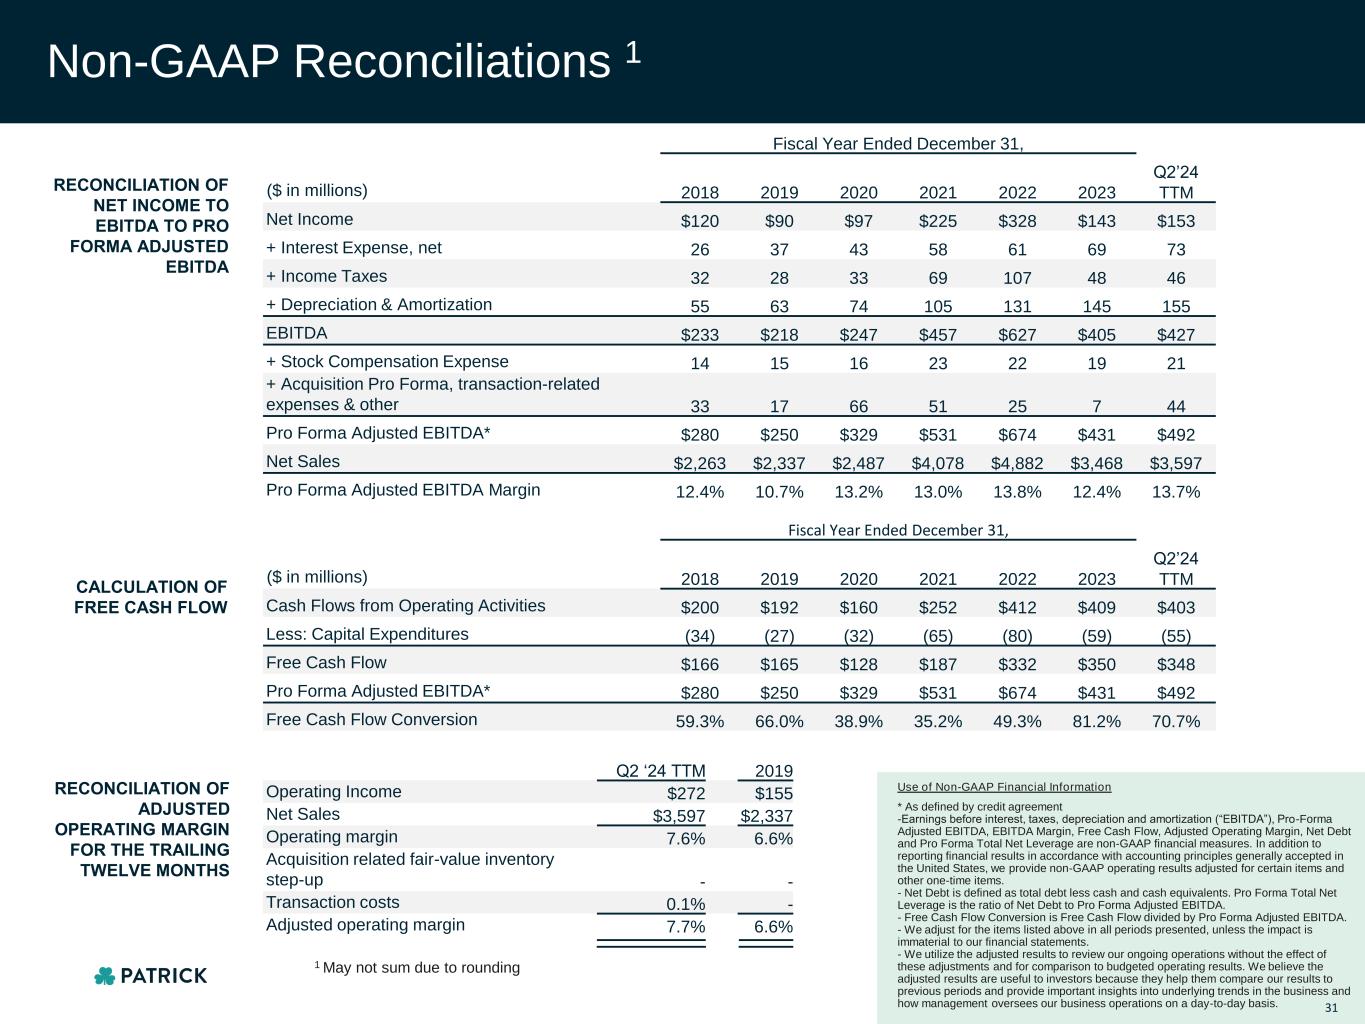
Use of Non-GAAP Financial Information * As defined by credit agreement -Earnings before interest, taxes, depreciation and amortization (“EBITDA”), Pro-Forma Adjusted EBITDA, EBITDA Margin, Free Cash Flow, Adjusted Operating Margin, Net Debt and Pro Forma Total Net Leverage are non-GAAP financial measures. In addition to reporting financial results in accordance with accounting principles generally accepted in the United States, we provide non-GAAP operating results adjusted for certain items and other one-time items. - Net Debt is defined as total debt less cash and cash equivalents. Pro Forma Total Net Leverage is the ratio of Net Debt to Pro Forma Adjusted EBITDA. - Free Cash Flow Conversion is Free Cash Flow divided by Pro Forma Adjusted EBITDA. - We adjust for the items listed above in all periods presented, unless the impact is immaterial to our financial statements. - We utilize the adjusted results to review our ongoing operations without the effect of these adjustments and for comparison to budgeted operating results. We believe the adjusted results are useful to investors because they help them compare our results to previous periods and provide important insights into underlying trends in the business and how management oversees our business operations on a day-to-day basis. Non-GAAP Reconciliations 1 RECONCILIATION OF NET INCOME TO EBITDA TO PRO FORMA ADJUSTED EBITDA Fiscal Year Ended December 31, ($ in millions) 2018 2019 2020 2021 2022 2023 Q2’24 TTM Net Income $120 $90 $97 $225 $328 $143 $153 + Interest Expense, net 26 37 43 58 61 69 73 + Income Taxes 32 28 33 69 107 48 46 + Depreciation & Amortization 55 63 74 105 131 145 155 EBITDA $233 $218 $247 $457 $627 $405 $427 + Stock Compensation Expense 14 15 16 23 22 19 21 + Acquisition Pro Forma, transaction-related expenses & other 33 17 66 51 25 7 44 Pro Forma Adjusted EBITDA* $280 $250 $329 $531 $674 $431 $492 Net Sales $2,263 $2,337 $2,487 $4,078 $4,882 $3,468 $3,597 Pro Forma Adjusted EBITDA Margin 12.4% 10.7% 13.2% 13.0% 13.8% 12.4% 13.7% 1 May not sum due to rounding Fiscal Year Ended December 31, ($ in millions) 2018 2019 2020 2021 2022 2023 Q2’24 TTM Cash Flows from Operating Activities $200 $192 $160 $252 $412 $409 $403 Less: Capital Expenditures (34) (27) (32) (65) (80) (59) (55) Free Cash Flow $166 $165 $128 $187 $332 $350 $348 Pro Forma Adjusted EBITDA* $280 $250 $329 $531 $674 $431 $492 Free Cash Flow Conversion 59.3% 66.0% 38.9% 35.2% 49.3% 81.2% 70.7% CALCULATION OF FREE CASH FLOW Q2 ‘24 TTM 2019 Operating Income $272 $155 Net Sales $3,597 $2,337 Operating margin 7.6% 6.6% Acquisition related fair-value inventory step-up - - Transaction costs 0.1% - Adjusted operating margin 7.7% 6.6% RECONCILIATION OF ADJUSTED OPERATING MARGIN FOR THE TRAILING TWELVE MONTHS 31
